
فیزیولوژی پزشکی گایتون و هال؛ تفسیر الکتروکاردیوگرافی ناهنجاری های ماهیچه قلب و جریان خون کرونر: تحلیل برداری


دعای مطالعه [ نمایش ]
بِسْمِ الله الرَّحْمنِ الرَّحیمِ
اَللّهُمَّ اَخْرِجْنى مِنْ ظُلُماتِ الْوَهْمِ
خدايا مرا بيرون آور از تاريكىهاى وهم،
وَ اَكْرِمْنى بِنُورِ الْفَهْمِ
و به نور فهم گرامى ام بدار،
اَللّهُمَّ افْتَحْ عَلَيْنا اَبْوابَ رَحْمَتِكَ
خدايا درهاى رحمتت را به روى ما بگشا،
وَانْشُرْ عَلَيْنا خَزائِنَ عُلُومِكَ بِرَحْمَتِكَ يا اَرْحَمَ الرّاحِمينَ
و خزانههاى علومت را بر ما باز كن به امید رحمتت اى مهربانترين مهربانان.
کتاب «فیزیولوژی پزشکی گایتون وهال» بهعنوان یکی از جامعترین و معتبرترین منابع در حوزه علوم پزشکی، همچنان مرجع کلیدی برای درک عملکرد پیچیده بدن انسان است. این اثر با تکیه بر تازهترین پژوهشها و توضیحات دقیق از سازوکارهای فیزیولوژیک، پلی میان علوم پایه پزشکی و کاربردهای بالینی ایجاد میکند و نقشی بیبدیل در آموزش، پژوهش و ارتقای دانش سلامت ایفا مینماید.
ترجمه دقیق و علمیاین شاهکار توسط برند علمیآیندهنگاران مغز به مدیریت داریوش طاهری، دسترسی فارسیزبانان به مرزهای نوین دانش فیزیولوژی را ممکن ساخته و رسالتی علمیبرای ارتقای آموزش پزشکی، فهم عمیقتر سازوکارهای بدن و توسعه روشهای نوین در حوزه سلامت فراهم آورده است.
» کتاب فیزیولوژی پزشکی گایتون وهال
» » فصل ۱۲: تفسیر الکتروکاردیوگرافی ناهنجاریهای ماهیچه قلب و جریان خون کرونر: تحلیل بُرداری
در حال ویرایش
» Guyton and Hall Textbook of Medical Physiology
»» CHAPTER 12: Electrocardiographic Interpretation of Cardiac Muscle and Coronary Blood Flow Abnormalities: Vectorial Analysis

From the discussion in Chapter 10 of impulse transmission through the heart, it is obvious that any change in the pattern of this transmission can cause abnormal electrical potentials around the heart and, consequently, alter the shapes of the waves in the electrocardiogram (ECG). For this reason, most serious abnormalities of the heart muscle can be diagnosed by analyzing the contours of the waves in the different electrocardiographic leads.
با توجه به بحث در فصل 10 انتقال تکانه از طریق قلب، بدیهی است که هرگونه تغییر در الگوی این انتقال میتواند باعث ایجاد پتانسیلهای الکتریکی غیرعادی در اطراف قلب و در نتیجه، تغییر شکل امواج در نوار قلب (ECG) شود. به همین دلیل، بیشتر ناهنجاریهای جدی عضله قلب را میتوان با تجزیه و تحلیل خطوط امواج در لیدهای مختلف الکتروکاردیوگرافی تشخیص داد.
VECTORIAL ANALYSIS OF ELECTROCARDIOGRAMS
آنالیز برداری الکتروکاردیوگرام
VECTORS CAN REPRESENT ELECTRICAL POTENTIALS
To understand how cardiac abnormalities affect the con- tours of the ECG, one must first become familiar with the concept of vectors and vectorial analysis as applied to electrical potentials in and around the heart. In Chapter 11, we pointed out that heart current flows in a particular direction in the heart at a given instant during the cardiac cycle. A vector is an arrow that points in the direction of the electrical potential generated by the current flow, with the arrowhead in the positive direction. Also, by convention, the length of the arrow is drawn proportional to the voltage of the potential.
بردارها میتوانند پتانسیلهای الکتریکی را نشان دهند
برای درک اینکه چگونه ناهنجاریهای قلبی بر خطوط نوار قلب تأثیر میگذارند، ابتدا باید با مفهوم بردارها و آنالیز برداری که برای پتانسیلهای الکتریکی داخل و اطراف قلب اعمال میشود، آشنا شد. در فصل 11، اشاره کردیم که جریان قلب در یک لحظه معین در طول چرخه قلبی در جهت خاصی در قلب جریان دارد. بردار فلشی است که در جهت پتانسیل الکتریکی تولید شده توسط جریان جریان است و نوک پیکان در جهت مثبت است. همچنین، طبق قرارداد، طول فلش متناسب با ولتاژ پتانسیل ترسیم میشود.
Resultant Vector in the Heart at Any Given Instant. The shaded area and the minus signs in Figure 12-1 show depolarization of the ventricular septum and of parts of the apical endocardial walls of the two ventricles. At the instant of heart excitation, electrical current flows between the depolarized areas inside the heart and the nondepolarized areas on the outside of the heart, as indicated by the long elliptical arrows. Some current also flows inside the heart chambers directly from the depolarized areas toward the still polarized areas. Overall, considerably more current flows downward from the base of the ventricles toward the apex than in the upward direction. Therefore, the summated vector of the generated potential at this particular instant, called the instantaneous mean vector, is represented by the long black arrow drawn through the center of the ventricles in a direction from the base toward the apex. Furthermore, because the summated current is quite large, the potential is large, and the vector is long.
بردار نتیجه در قلب در هر لحظه. ناحیه سایهدار و علائم منفی در شکل 1-12 دپلاریزاسیون سپتوم بطنی و بخشهایی از دیوارههای اندوکارد آپیکال دو بطن را نشان میدهند. در لحظه تحریک قلب، جریان الکتریکی بین نواحی دپلاریزه شده در داخل قلب و نواحی غیردپلاریزه شده در بیرون قلب جریان مییابد، همانطور که با فلشهای بلند بیضوی نشان داده میشود. مقداری جریان نیز در داخل حفرههای قلب مستقیماً از نواحی دپلاریزه شده به سمت نواحی قطبی هنوز جریان مییابد. به طور کلی، جریان به طور قابل توجهی بیشتر از پایه بطنها به سمت راس به سمت پایین جریان مییابد تا در جهت بالا. بنابراین، بردار مجموع پتانسیل تولید شده در این لحظه خاص، که بردار میانگین آنی نامیده میشود، با فلش سیاه بلندی که از مرکز بطنها در جهتی از قاعده به سمت راس کشیده شده است، نشان داده میشود. علاوه بر این، به دلیل اینکه جریان جمع شده بسیار زیاد است، پتانسیل بزرگ است و بردار طولانی است.
THE DIRECTION OF A VECTOR IS DENOTED IN TERMS OF DEGREES
When a vector is exactly horizontal and directed toward the person’s left side, the vector is said to extend in the direction of 0 degrees, as shown in Figure 12-2. From this zero reference point, the scale of vectors rotates clock- wise; when the vector extends from above and straight downward, it has a direction of +90 degrees, when it extends from the person’s left to right, it has a direction of +180 degrees, and when it extends straight upward, it has a direction of -90 (or +270) degrees.
جهت یک بردار بر حسب درجه مشخص میشود
هنگامیکه یک بردار دقیقاً افقی است و به سمت چپ فرد هدایت میشود، گفته میشود که بردار در جهت 0 درجه گسترش مییابد، همانطور که در شکل 12-2 نشان داده شده است. از این نقطه مرجع صفر، مقیاس بردارها در جهت عقربههای ساعت میچرخد. زمانی که بردار از بالا و مستقیم به پایین امتداد مییابد جهت 90+ و هنگامیکه از چپ به راست فرد امتداد مییابد دارای جهت 180+ درجه و هنگامیکه مستقیم به سمت بالا امتداد مییابد جهت 90- (یا 270+) درجه دارد.
In a normal heart, the average direction of the vector during spread of the depolarization wave through the ventricles, called the mean QRS vector, is about +59 degrees, which is shown by vector A drawn through the center of Figure 12-2 in the +59-degree direction. This means that during most of the depolarization wave, the apex of the heart remains positive with respect to the base of the heart, as discussed later in this chapter.
در یک قلب طبیعی، جهت متوسط ناقل در حین پخش موج دپلاریزاسیون از طریق بطنها، که بردار QRS متوسط نامیده میشود، حدود 59+ درجه است که با بردار A که از مرکز شکل 12-2 در جهت 59+ درجه کشیده شده است، نشان داده شده است. این بدان معنی است که در طول بیشتر موج دپلاریزاسیون، راس قلب نسبت به قاعده قلب مثبت باقی میماند، همانطور که بعداً در این فصل بحث شد.
AXIS FOR EACH STANDARD BIPOLAR LEAD AND EACH UNIPOLAR LIMB LEAD
In Chapter 11, the three standard bipolar and the three unipolar limb leads are described. Each lead is actually a pair of electrodes connected to the body on opposite sides of the heart, and the direction from negative electrode to positive electrode is called the axis of the lead. Lead I is recorded from two electrodes placed respectively on the two arms. Because the electrodes lie exactly in the horizontal direction, with the positive electrode to the left, the axis of lead I is 0 degrees.
محور برای هر لید استاندارد دوقطبی و هر لید اندامیتک قطبی
در فصل 11، سه لید استاندارد دوقطبی و سه لید اندام تک قطبی توضیح داده شده است. هر لید در واقع یک جفت الکترود است که در طرفین مخالف قلب به بدن متصل شده اند و جهت الکترود منفی به الکترود مثبت را محور لید مینامند. لید I از دو الکترود قرار داده شده به ترتیب روی دو بازو ثبت میشود. از آنجایی که الکترودها دقیقاً در جهت افقی قرار دارند، با الکترود مثبت در سمت چپ، محور لیذ I 0 درجه است.
In recording lead II, electrodes are placed on the right arm and left leg. The right arm connects to the torso in the upper right-hand corner, and the left leg connects in the lower left-hand corner. Therefore, the direction of this lead is about +60 degrees.
در ضبط لید II، الکترودها روی دست راست و پای چپ قرار میگیرند. بازوی راست در گوشه بالا سمت راست به بالاتنه و پای چپ در گوشه پایین سمت چپ وصل میشود. بنابراین جهت این لید حدود 60+ درجه است.
By similar analysis, it can be seen that lead III has an axis of about +120 degrees, lead aVR, +210 degrees, lead aVF, +90 degrees, and lead aVL, -30 degrees. The directions of the axes of all these leads are shown in Figure 12-3, which is known as the hexagonal reference system. The polarities of the electrodes are shown by the plus and minus signs in the figure. The reader must learn these axes and their polarities, particularly for the bipolar limb leads I, II, and III, to understand the remainder of this chapter.
با تجزیه و تحلیل مشابه، میتوان دید که محور III در حدود 120+ درجه، لید aVR، +210 درجه، لید aVF، +90 درجه و لید aVL، -30 درجه است. جهت محورهای تمام این سرنخها در شکل 12-3 نشان داده شده است که به عنوان سیستم مرجع شش ضلعی شناخته میشود. قطبیت الکترودها با علامت مثبت و منفی در شکل نشان داده شده است. خواننده باید این محورها و قطبیتهای آنها را یاد بگیرد، به ویژه برای لیدهای دوقطبی I، II و III، تا بقیه این فصل را بفهمد.
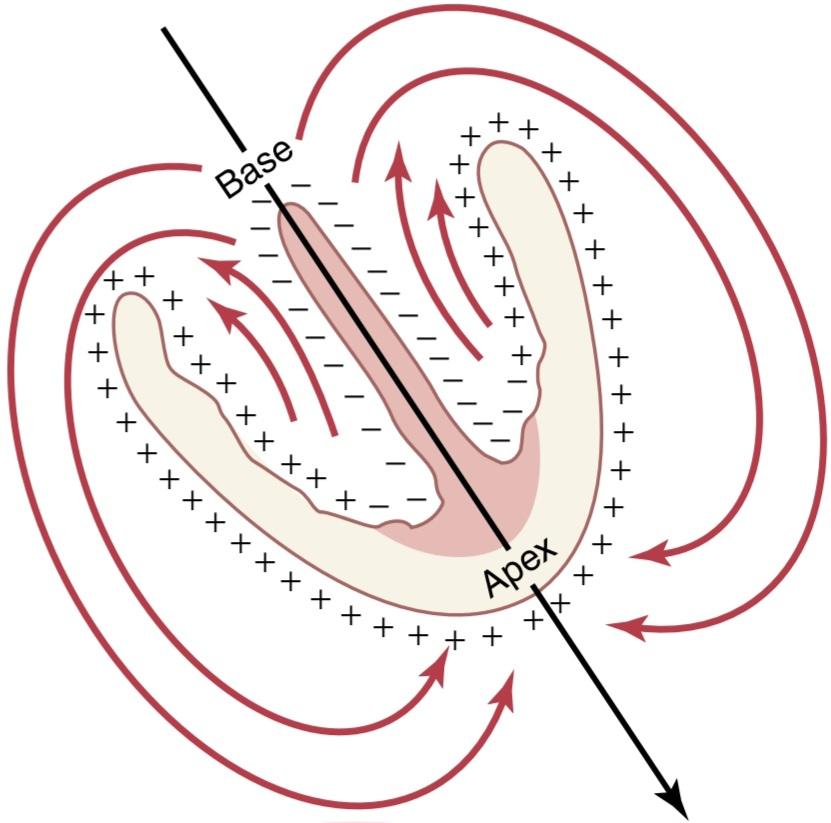
Figure 12-1 Mean vector through the partially depolarized ventricles goes from the base of the left ventricle towards the apex.
شکل 12-1 میانگین بردار از طریق بطنهای نیمه دپلاریزه شده از پایه بطن چپ به سمت راس میرود.
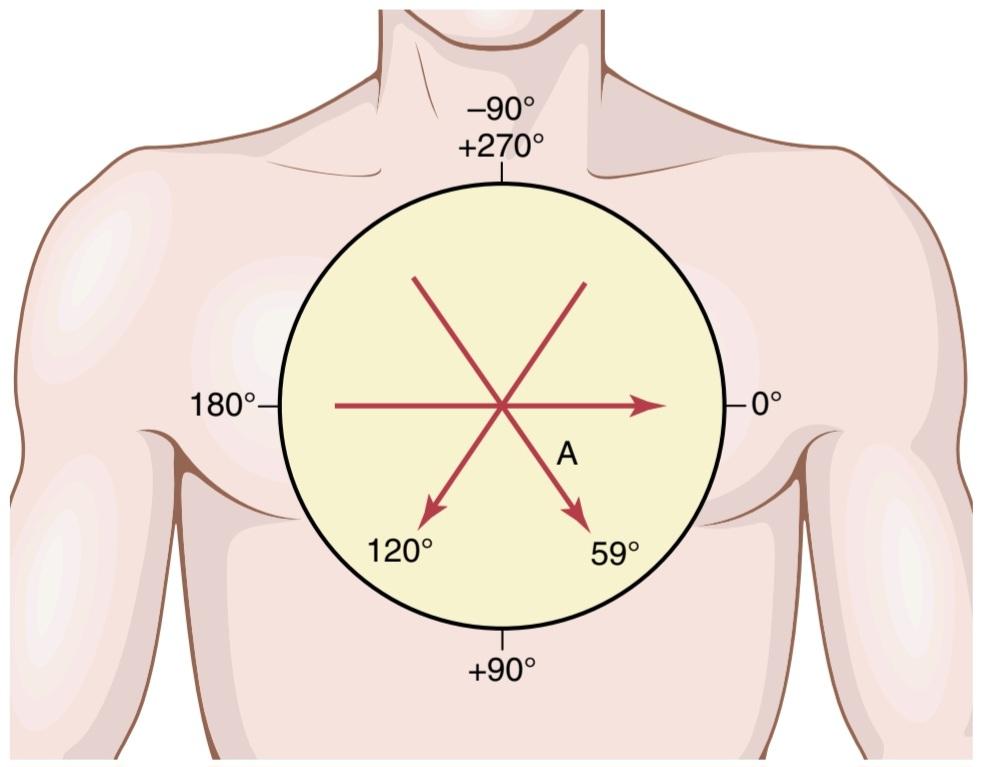
Figure 12-2 Vectors drawn to represent potentials for several different hearts and the axis of the potential (expressed in degrees) for each heart.
شکل 12-2 بردارهایی ترسیم شده اند تا پتانسیلهای چند قلب مختلف و محور پتانسیل (بیان شده بر حسب درجه) را برای هر قلب نشان دهند.
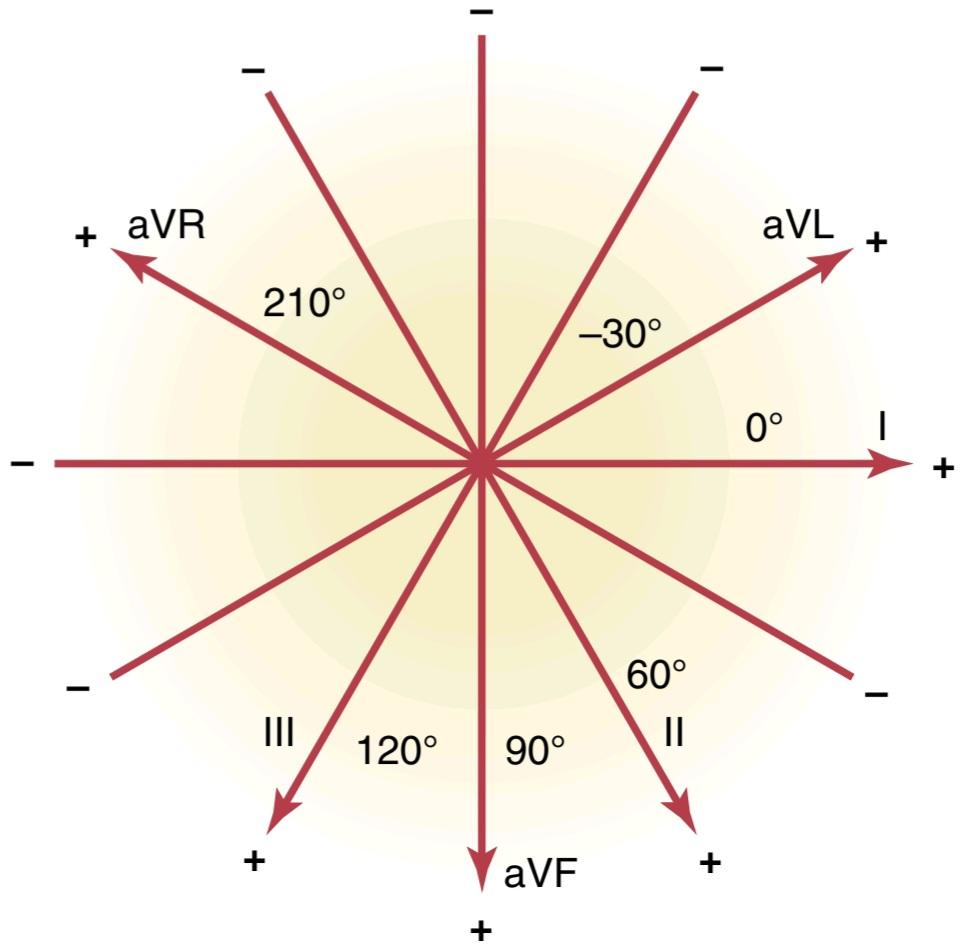
Figure 12-3 Axes of the three bipolar and three unipolar leads.
شکل 12-3 محورهای سه لید دوقطبی و سه لید تک قطبی.
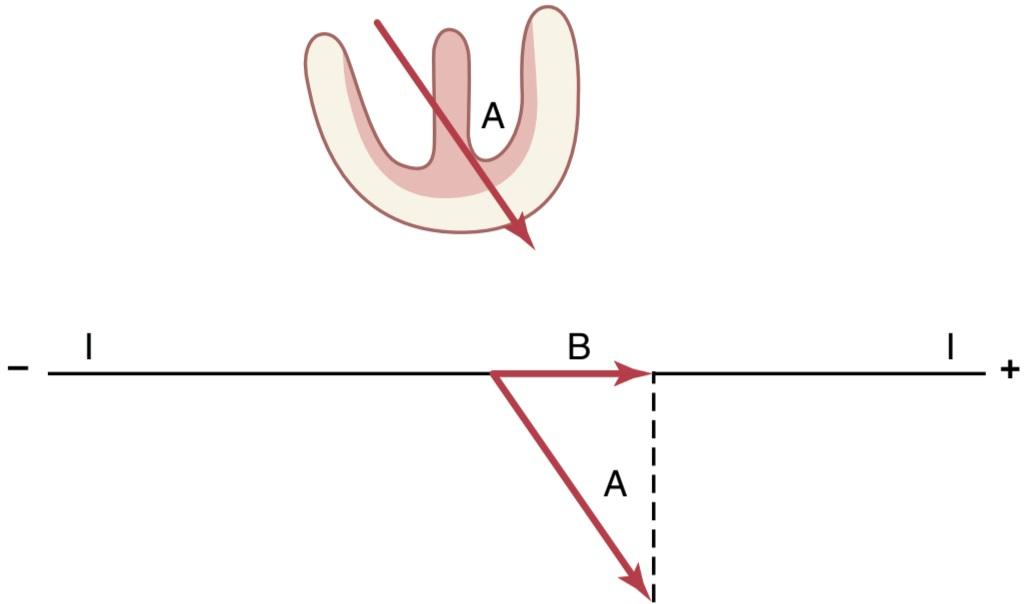
Figure 12-4 Determination of a projected vector B along the axis of lead I when vector A represents the instantaneous potential in the ventricles.
شکل 12-4 تعیین یک بردار پیش بینی شده B در امتداد محور لید I زمانی که بردار A پتانسیل لحظه ای در بطنها را نشان میدهد.
VECTORIAL ANALYSIS OF POTENTIALS RECORDED IN DIFFERENT LEADS
Figure 12-4 shows a partially depolarized heart, with vector A representing the instantaneous mean direction of current flow in the ventricles. In this case, the direction of the vector is +55 degrees, and the voltage of the potential, represented by the length of vector A, is 2 millivolts. In the diagram below the heart, vector A is shown again, and a line is drawn to represent the axis of lead I in the 0-degree direction. To determine how much of the voltage in vector A will be recorded in lead I, a line perpendicular to the axis of lead I is drawn from the tip of vector A to the lead I axis, and a so-called projected vector (B) is drawn along the lead I axis. The arrow of this projected vector points toward the positive end of the lead I axis, which means that the record momentarily being recorded in the ECG of lead I is positive. The instantaneous recorded voltage will be equal to the length of B divided by the length of A times 2 millivolts, or about 1 millivolt.
تجزیه و تحلیل برداری پتانسیلهای ثبت شده در سرنخهای مختلف
شکل 12-4 یک قلب نیمه دپلاریزه را نشان میدهد که بردار A نشان دهنده جهت میانگین لحظه ای جریان در بطنها است. در این حالت جهت بردار 55+ درجه است و ولتاژ پتانسیل که با طول بردار A نشان داده میشود 2 میلی ولت است. در نمودار زیر قلب، بردار A دوباره نشان داده شده است و خطی برای نشان دادن محور لید I در جهت 0 درجه ترسیم شده است. برای تعیین اینکه چه مقدار از ولتاژ بردار A در لید I ثبت میشود، یک خط عمود بر محور لید I از نوک بردار A تا محور لید I رسم میشود و یک بردار به اصطلاح پیش بینی شده (B) در امتداد محور لید I رسم میشود. فلش این بردار پیش بینی شده به سمت انتهای مثبت محور لید I است، به این معنی که رکورد ثبت شده لحظه ای در ECG لید I مثبت است. ولتاژ لحظه ای ثبت شده برابر است با طول B تقسیم بر طول A ضربدر 2 میلی ولت یا حدود 1 میلی ولت.
Figure 12-5 shows another example of vectorial analysis. In this example, vector A represents the electrical potential and its axis at a given instant during ventricular depolarization in a heart in which the left side of the heart depolarizes more rapidly than the right side. In this case, the instantaneous vector has a direction of 100 degrees, and its voltage is again 2 millivolts. To determine the potential actually recorded in lead I, we draw a perpendicular line from the tip of vector A to the lead I axis and find projected vector B. Vector B is very short, and this time it is in the negative direction, indicating that at this particular instant, the recording in lead I will be negative (below the zero line in the ECG), and the voltage recorded will be small, about -0.3 millivolts. This figure demonstrates that when the vector in the heart is in a direction almost perpendicular to the axis of the lead, the voltage recorded in the ECG of this lead is very low. Conversely, when the heart vector has almost exactly the same axis as the lead axis, essentially the entire voltage of the vector will be recorded.
شکل 12-5 نمونه دیگری از تحلیل برداری را نشان میدهد. در این مثال، بردار A پتانسیل الکتریکی و محور آن را در یک لحظه معین در حین دپلاریزاسیون بطنی در قلبی که در آن سمت چپ قلب سریعتر از سمت راست دپلاریزه میشود، نشان میدهد. در این حالت بردار لحظه ای جهت 100 درجه دارد و ولتاژ آن دوباره 2 میلی ولت است. برای تعیین پتانسیل واقعی ثبت شده در لید I، یک خط عمود از نوک بردار A به محور لید I رسم میکنیم و بردار B پیش بینی شده را پیدا میکنیم. بردار B بسیار کوتاه است، و این بار در جهت منفی است، که نشان میدهد در این لحظه خاص، ثبت در لید I منفی خواهد بود (زیر خط صفر در ECG)، و ولتاژ آن در حدود 0،3 میلی متر ثبت میشود. این شکل نشان میدهد که وقتی بردار قلب در جهتی تقریباً عمود بر محور لید است، ولتاژ ثبت شده در ECG این لید بسیار پایین است. برعکس، زمانی که بردار قلب تقریباً دقیقاً همان محور محور لید را داشته باشد، اساساً کل ولتاژ بردار ثبت خواهد شد.
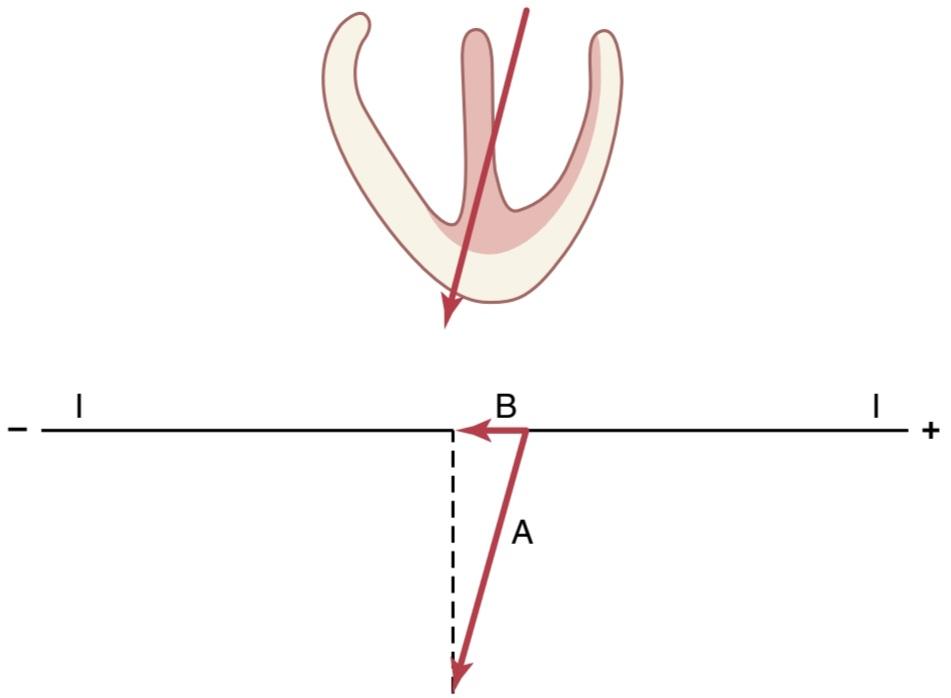
Figure 12-5 Determination of the projected vector B along the axis of lead I when vector A represents the instantaneous potential in the ventricles.
شکل 12-5 تعیین بردار پیش بینی شده B در امتداد محور لید I زمانی که بردار A پتانسیل لحظه ای در بطنها را نشان میدهد.

Figure 12-6 Determination of projected vectors in leads I, II, and III when vector A represents the instantaneous potential in the ventricles.
شکل 12-6 تعیین بردارهای پیش بینی شده در لیدهای I، II و III زمانی که بردار A پتانسیل لحظه ای در بطنها را نشان میدهد.
Vectorial Analysis of Potentials in the Three Standard Bipolar Limb Leads. In Figure 12-6, vector A depicts the instantaneous electrical potential of a partially depolarized heart. To determine the potential recorded at this instant in the ECG for each one of the three standard bipolar limb leads, perpendicular lines (the dashed lines) are drawn from the tip of vector A to the three lines rep- resenting the axes of the three different standard leads, as shown in the figure. The projected vector B depicts the potential recorded at that instant in lead I, projected vector C depicts the potential in lead II, and projected vector D depicts the potential in lead III. In each of these, the record in the ECG is positive-that is, above the zero line-because the projected vectors point in the positive directions along the axes of all the leads. The potential in lead I (vector B) is about half of that of the actual potential in the heart (vector A), in lead II (vector C), it is almost equal to that in the heart and, in lead III (vector D), it is about one-third that in the heart.
تحلیل برداری پتانسیلها در سه لید استاندارد دوقطبی اندام. در شکل 12-6، بردار A پتانسیل الکتریکی آنی یک قلب نیمه دپلاریزه شده را نشان میدهد. برای تعیین پتانسیل ثبت شده در این لحظه در ECG برای هر یک از سه لید استاندارد دوقطبی اندام، خطوط عمود بردار (خطوط چین) از نوک بردار A تا سه خط نشان دهنده محورهای سه لید استاندارد مختلف، همانطور که در شکل نشان داده شده است، ترسیم میشود. بردار پیشبینیشده B پتانسیل ثبتشده در آن لحظه در لید I را نشان میدهد، بردار پیشبینیشده C پتانسیل را در لید II نشان میدهد، و بردار پیشبینیشده D پتانسیل را در لید III نشان میدهد. در هر یک از اینها، رکورد در ECG مثبت است – یعنی بالای خط صفر – زیرا بردارهای پیش بینی شده در جهت مثبت در امتداد محورهای تمام لیدها قرار میگیرند. پتانسیل در لید I (بردار B) تقریباً نیمیاز پتانسیل واقعی در قلب (بردار A) است، در لید II (بردار C) تقریباً برابر با پتانسیل در قلب است و در لید III (بردار D) تقریباً یک سوم آن در قلب است.
An identical analysis can be used to determine potentials recorded in augmented limb leads, except that the respective axes of the augmented leads (see Figure 12-3) are used in place of the standard bipolar limb lead axes used for Figure 12-6.
برای تعیین پتانسیلهای ثبت شده در لیدهای اندام تقویت شده میتوان از یک تحلیل مشابه استفاده کرد، با این تفاوت که محورهای مربوط به لیدهای تقویت شده (نگاه کنید به شکل 12-3) به جای محورهای لید اندام دوقطبی استاندارد استفاده شده در شکل 12-6 استفاده میشود.
VECTORIAL ANALYSIS OF THE NORMAL ELECTROCARDIOGRAM
VECTORS THAT OCCUR AT SUCCESSIVE INTERVALS DURING DEPOLARIZATION OF THE VENTRICLES-THE QRS COMPLEX
When the cardiac impulse enters the ventricles through the atrioventricular bundle, the first part of the ventricles to become depolarized is the left endocardial surface of the septum. Then, depolarization spreads rapidly to involve both endocardial surfaces of the septum, as shown by the darker shaded portion of the ventricle in Figure 12-7A. Next, depolarization spreads along the endocardial surfaces of the remainder of the two ventricles, as shown in Figure 12-7B and C. Finally, it spreads through the ventricular muscle to the outside of the heart, as shown progressively in Figure 12-7C to E.
تجزیه و تحلیل برداری از الکتروکاردیوگرام نرمال
ناقلهایی که در فواصل متوالی در حین دپولاریزاسیون بطنها رخ میدهند – کمپلکس QRS
هنگامیکه تکانه قلبی از طریق بسته دهلیزی به بطنها وارد میشود، اولین قسمتی از بطنها که دپلاریزه میشود، سطح اندوکاردیال سمت چپ سپتوم است. سپس، دپلاریزاسیون به سرعت گسترش مییابد و هر دو سطح اندوکاردی سپتوم را درگیر میکند، همانطور که توسط قسمت سایه دارتر بطن در شکل 12-7A نشان داده شده است. سپس، دپلاریزاسیون در امتداد سطوح اندوکاردی باقیمانده دو بطن گسترش مییابد، همانطور که در شکل 12-7B و C نشان داده شده است. در نهایت، از طریق عضله بطنی به خارج از قلب گسترش مییابد، همانطور که در شکل 12-7C تا E نشان داده شده است.
At each stage in Figure 12-7, A to E, the instantaneous mean electrical potential of the ventricles is represented by a red vector superimposed on the ventricle in each figure. Each of these vectors is then analyzed by the method described in the preceding section to determine the volt- ages that will be recorded at each instant in each of the three standard electrocardiographic leads. To the right in each Figure is shown progressive development of the electrocardiographic QRS complex. Keep in mind that a positive vector in a lead will cause recording in the ECG above the zero line, whereas a negative vector will cause recording below the zero line.
در هر مرحله در شکل 12-7، A تا E، میانگین پتانسیل الکتریکی آنی بطنها با یک بردار قرمز که در هر شکل بر روی بطن قرار گرفته نشان داده میشود. سپس هر یک از این بردارها با روشی که در بخش قبل توضیح داده شد، تجزیه و تحلیل میشود تا ولتاژهایی که در هر لحظه در هر یک از سه لید استاندارد الکتروکاردیوگرافی ثبت میشوند، تعیین شود. در سمت راست در هر شکل، توسعه تدریجی مجتمع QRS الکتروکاردیوگرافی نشان داده شده است. به خاطر داشته باشید که یک بردار مثبت در یک لید باعث ثبت ECG بالای خط صفر میشود، در حالی که یک بردار منفی باعث ثبت زیر خط صفر میشود.
Before proceeding with further consideration of vectorial analysis, it is essential that this analysis of the successive normal vectors presented in Figure 12-7 be understood. Each of these analyses should be studied in detail by the procedure given here. A short summary of this sequence follows.
قبل از ادامه بررسی بیشتر تحلیل برداری، ضروری است که این تحلیل بردارهای نرمال متوالی ارائه شده در شکل 12-7 درک شود. هر یک از این تجزیه و تحلیلها باید با روشی که در اینجا ارائه شده است به تفصیل مورد مطالعه قرار گیرد. خلاصه ای کوتاه از این سکانس در ادامه میآید.
In Figure 12-74, the ventricular muscle has just begun to be depolarized, representing an instant about 0.01 second after the onset of depolarization. At this time, the vector is short because only a small portion of the ventricles-the septum is depolarized. Therefore, all electrocardiographic voltages are low, as recorded to the right of the ventricular muscle for each of the leads. The voltage in lead II is greater than the voltages in leads I and III because the heart vector extends mainly in the same direction as the axis of lead II.
در شکل 12-74، عضله بطنی به تازگی شروع به دپلاریزه شدن کرده است که نشان دهنده یک لحظه در حدود 0.01 ثانیه پس از شروع دپلاریزاسیون است. در این زمان، ناقل کوتاه است، زیرا تنها بخش کوچکی از بطنها – سپتوم دپلاریزه شده است. بنابراین، تمام ولتاژهای الکتروکاردیوگرافی کم هستند، همانطور که در سمت راست عضله بطنی برای هر یک از لیدها ثبت شده است. ولتاژ در لید II بیشتر از ولتاژ در لیدهای I و III است زیرا بردار قلب عمدتاً در همان جهت محور لید II گسترش مییابد.
In Figure 12-7B, which represents about 0.02 second after onset of depolarization, the heart vector is long because much of the ventricular muscle mass has become depolarized. Therefore, the voltages in all electrocardio- graphic leads have increased.
در شکل 12-7B، که حدود 0.02 ثانیه پس از شروع دپلاریزاسیون را نشان میدهد، ناقل قلب طولانی است زیرا بسیاری از توده عضلانی بطنی دپلاریزه شده است. بنابراین، ولتاژ در تمام سرنخهای الکتروکاردیوگرافی افزایش یافته است.
In Figure 12-7C, about 0.035 second after onset of depolarization, the heart vector is becoming shorter, and the recorded electrocardiographic voltages are lower, because the outside of the heart apex is now electronegative, neutralizing much of the positivity on the other epicardial surfaces of the heart. Also, the axis of the vector is beginning to shift toward the left side of the chest because the left ventricle is slightly slower to depolarize than the right ventricle. Therefore, the ratio of the voltage in lead I to that in lead III is increasing.
در شکل 12-7C، حدود 0.035 ثانیه پس از شروع دپلاریزاسیون، بردار قلب کوتاهتر میشود و ولتاژهای الکتروکاردیوگرافی ثبتشده کمتر است، زیرا قسمت بیرونی راس قلب اکنون الکترونگاتیو است و بسیاری از مثبت بودن سایر سطوح اپیکاردی قلب را خنثی میکند. همچنین، محور ناقل شروع به جابجایی به سمت چپ قفسه سینه میکند، زیرا بطن چپ کمیکندتر از بطن راست دپلاریزه میشود. بنابراین، نسبت ولتاژ در لید I به ولتاژ در لید III در حال افزایش است.
In Figure 12-7D, about 0.05 second after onset of depolarization, the heart vector points toward the base of the left ventricle, and it is short because only a minute portion of the ventricular muscle is still polarized positive. Because of the direction of the vector at this time, the voltages recorded in leads II and III are both negative—that is, below the line-whereas the voltage of lead I is still positive.
در شکل 12-7D، حدود 0.05 ثانیه پس از شروع دپلاریزاسیون، بردار قلب به سمت قاعده بطن چپ میرود، و کوتاه است زیرا تنها یک دقیقه از عضله بطنی هنوز قطبی شده مثبت است. به دلیل جهت بردار در این زمان، ولتاژهای ثبت شده در لیدهای II و III هر دو منفی هستند – یعنی زیر خط – در حالی که ولتاژ لید I هنوز مثبت است.
In Figure 12-7E, about 0.06 second after onset of depolarization, the entire ventricular muscle mass is depolarized so that no current flows around the heart and no electrical potential is generated. The vector becomes zero, and the voltages in all leads become zero.
در شکل 12-7E، حدود 0.06 ثانیه پس از شروع دپلاریزاسیون، کل توده عضلانی بطنی دپلاریزه میشود به طوری که جریانی در اطراف قلب جریان ندارد و پتانسیل الکتریکی تولید نمیشود. بردار صفر میشود و ولتاژ در همه لیدها صفر میشود.
Thus, the QRS complexes are completed in the three standard bipolar limb leads.
بنابراین، کمپلکسهای QRS در سه لید استاندارد دوقطبی اندام تکمیل میشوند.
Sometimes the QRS complex has a slight negative depression at its beginning in one or more of the leads, which is not shown in Figure 12-7; this depression is the Q wave. When it occurs, it is caused by initial depolarization of the left side of the septum before the right side, which creates a weak vector from left to right for a fraction of a second before the usual base to apex vector occurs. The major positive deflection shown in Figure 12-7 is the R wave, and the final negative deflection is the S wave.
گاهی اوقات کمپلکس QRS در ابتدای خود دارای یک فرورفتگی منفی خفیف در یک یا چند لید است که در شکل 12-7 نشان داده نشده است. این فرورفتگی موج Q است. هنگامیکه رخ میدهد، ناشی از دپولاریزاسیون اولیه سمت چپ سپتوم قبل از سمت راست است، که یک بردار ضعیف از چپ به راست برای کسری از ثانیه قبل از ایجاد بردار معمولی قاعده به راس ایجاد میکند. انحراف مثبت اصلی نشان داده شده در شکل 12-7 موج R و انحراف منفی نهایی موج S است.

Figure 12-7 Shaded areas of the ventricles are depolarized (-); nonshaded areas are still polarized (+). Shown are the ventricular vectors and QRS complexes 0.01 second after onset of ventricular depolarization (A), 0.02 second after onset of depolarization (B), 0.035 second after onset of depolarization (C), 0.05 second after onset of depolarization (D), and after depolarization of the ventricles is complete, 0.06 second after onset (E).
شکل 12-7 نواحی سایه دار بطنها دپلاریزه میشوند (-). مناطق بدون سایه هنوز قطبی هستند (+). وکتورهای بطنی و کمپلکسهای QRS 0.01 ثانیه پس از شروع دپلاریزاسیون بطنی (A)، 0.02 ثانیه پس از شروع دپلاریزاسیون (B)، 0.035 ثانیه پس از شروع دپلاریزاسیون (C)، 0.05 ثانیه پس از شروع دپلاریزاسیون (D) و پس از شروع دپلاریزاسیون (D. 0.0 ثانیه پس از دپلاریزاسیون کامل است).
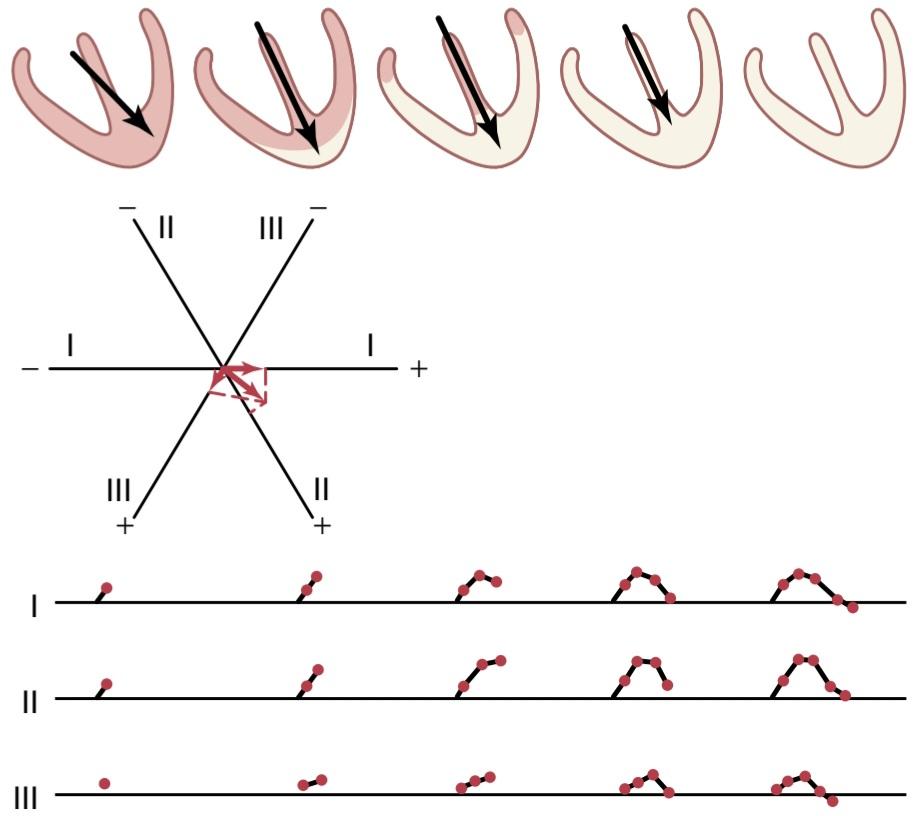
Figure 12-8 Generation of the T wave during repolarization of the ventricles, also showing vectorial analysis of the first stage of repolarization. The total time from the beginning of the T wave to its end is approximately 0.15 second.
شکل 12-8 تولید موج T در حین رپلاریزاسیون بطنها، همچنین تجزیه و تحلیل برداری مرحله اول رپلاریزاسیون را نشان میدهد. کل زمان از آغاز موج T تا پایان آن تقریباً 0.15 ثانیه است.
ELECTROCARDIOGRAM DURING VENTRI- CULAR REPOLARIZATION-THE T WAVE
After the ventricular muscle has become depolarized, about 0.15 second later, repolarization begins and proceeds until complete, at about 0.35 second. This repolar- ization causes the T wave in the ECG.
الکتروکاردیوگرام در حین رپولاریزاسیون بطنی – موج T
پس از دپلاریزه شدن عضله بطنی، حدود 0.15 ثانیه بعد، رپلاریزاسیون شروع میشود و تا کامل شدن آن، در حدود 0.35 ثانیه ادامه مییابد. این رپولاریزاسیون باعث ایجاد موج T در ECG میشود.
Because the septum and endocardial areas of the ventricular muscle depolarize first, it seems logical that these areas should repolarize first as well. However, this is not the usual case, because the septum and other endocardial areas have a longer period of contraction than most of the external surfaces of the heart. There- fore, the greatest portion of ventricular muscle mass to repolarize first is the entire outer surface of the ventricles, especially near the apex of the heart. The endocardial areas, conversely, normally repolarize last. This sequence of repolarization is postulated to be caused by the high blood pressure inside the ventricles during contraction, which greatly reduces coronary blood flow to the endocardium, thereby slowing repolarization in the endocardial areas.
از آنجایی که سپتوم و نواحی اندوکاردی عضله بطنی ابتدا دپلاریزه میشوند، منطقی به نظر میرسد که این نواحی نیز ابتدا رپلاریزه شوند. با این حال، این مورد معمول نیست، زیرا سپتوم و سایر نواحی اندوکارد نسبت به بسیاری از سطوح خارجی قلب دوره انقباض طولانی تری دارند. بنابراین، بیشترین قسمتی از توده عضلانی بطنی که ابتدا رپولاریزه میشود، کل سطح بیرونی بطنها، بهویژه نزدیک به راس قلب است. برعکس، نواحی اندوکاردیال معمولاً در آخر رپلاریزه میشوند. فرض بر این است که این توالی رپلاریزاسیون ناشی از فشار خون بالا در داخل بطنها در حین انقباض است که جریان خون کرونری را تا حد زیادی کاهش میدهد و در نتیجه باعث کاهش رپلاریزاسیون در نواحی اندوکارد میشود.
Because the outer apical surfaces of the ventricles repolarize before the inner surfaces, the positive end of the overall ventricular vector during repolarization is toward the apex of the heart. As a result, the normal T wave in all three bipolar limb leads is positive, which is also the polarity of most of the normal QRS complex.
از آنجایی که سطوح اپیکال خارجی بطنها قبل از سطوح داخلی مجدداً قطبی میشوند، انتهای مثبت ناقل کلی بطن در حین رپلاریزاسیون به سمت راس قلب است. در نتیجه، موج T نرمال در هر سه لید اندام دوقطبی مثبت است که قطبیت بیشتر کمپلکس QRS طبیعی نیز میباشد.
In Figure 12-8, five stages of repolarization of the ventricles are denoted by progressive increase of the light tan areas the repolarized areas. At each stage, the vector extends from the base of the heart toward the apex until it disappears in the last stage. At first, the vector is relatively small because the area of repolarization is small. Later, the vector becomes stronger because of greater degrees of repolarization. Finally, the vector becomes weaker again because the areas of depolarization still persisting become so slight that the total quantity of current flow decreases. These changes also demonstrate that the vector is greatest when about half the heart is in the polarized state and about half is depolarized.
در شکل 12-8، پنج مرحله از رپولاریزاسیون بطنها با افزایش تدریجی نواحی برنزه روشن نواحی رپلاریزه شده نشان داده شده است. در هر مرحله، بردار از قاعده قلب به سمت راس گسترش مییابد تا زمانی که در آخرین مرحله ناپدید شود. در ابتدا، بردار نسبتاً کوچک است زیرا ناحیه رپلاریزاسیون کوچک است. بعداً، بردار به دلیل درجات بیشتر رپلاریزاسیون قوی تر میشود. در نهایت، بردار دوباره ضعیفتر میشود، زیرا نواحی دپلاریزاسیون همچنان پابرجا هستند، چنان ناچیز میشوند که مقدار کل جریان کاهش مییابد. این تغییرات همچنین نشان میدهد که بردار زمانی که تقریباً نیمیاز قلب در حالت پلاریزه و حدود نیمیاز آن دپلاریزه است، بیشترین مقدار را دارد.
The changes in the ECGs of the three standard limb leads during repolarization are noted under each of the ventricles, depicting the progressive stages of repolarization. Thus, over about 0.15 second, the period of time required for the entire process to take place, the T wave of the ECG is generated.
تغییرات در ECG سه لید استاندارد اندام در طی رپلاریزاسیون در زیر هر یک از بطنها مشاهده میشود که مراحل پیشرونده رپلاریزاسیون را به تصویر میکشد. بنابراین، در حدود 0.15 ثانیه، دوره زمانی مورد نیاز برای انجام کل فرآیند، موج T ECG تولید میشود.
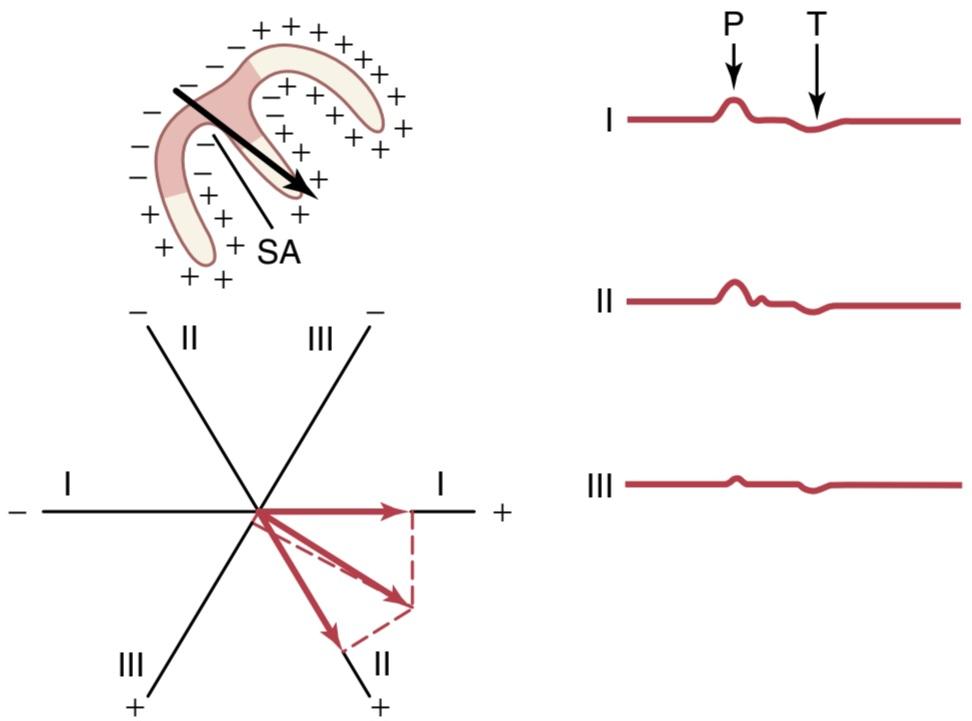
Figure 12-9 Depolarization of the atria and generation of the P wave showing the maximum vector through the atria and the resultant vectors in the three standard leads. At the right are the atrial P and T waves. SA, Sinoatrial node.
شکل 12-9 دپلاریزاسیون دهلیزها و تولید موج P که حداکثر بردار را از دهلیزها و بردارهای حاصل را در سه لید استاندارد نشان میدهد. در سمت راست، امواج P و T دهلیزی قرار دارند. SA، گره سینوسی دهلیزی.
ATRIAL DEPOLARIZATION-THE P WAVE
Depolarization of the atria begins in the sinus node and spreads in all directions over the atria. Therefore, the point of original electronegativity in the atria is at about the point of entry of the superior vena cava where the sinus node lies, and the direction of initial depolarization is denoted by the black vector in Figure 12-9. Furthermore, the vector remains generally in this direction throughout the process of normal atrial depolarization. Because this direction is generally in the positive directions of the axes of the three standard bipolar limb leads I, II, and III, the ECGs recorded from the atria during depolarization are also usually positive in all three of these leads, as shown in Figure 12-9. This record of atrial depolarization is known as the atrial P wave.
دپولاریزاسیون دهلیزی – موج P
دپلاریزاسیون دهلیزها از گره سینوسی شروع میشود و در تمام جهات روی دهلیز گسترش مییابد. بنابراین، نقطه الکترونگاتیوی اولیه در دهلیز تقریباً در نقطه ورود ورید اجوف فوقانی است که گره سینوسی در آن قرار دارد و جهت دپلاریزاسیون اولیه با بردار سیاه رنگ در شکل 12-9 نشان داده شده است. علاوه بر این، بردار به طور کلی در طول فرآیند دپلاریزاسیون دهلیزی طبیعی در این جهت باقی میماند. از آنجایی که این جهت عموماً در جهت مثبت محورهای سه لید استاندارد اندام دوقطبی I، II و III است، ECGهای ثبت شده از دهلیزها در طول دپلاریزاسیون نیز معمولاً در هر سه این لیدها مثبت هستند، همانطور که در شکل 12-9 نشان داده شده است. این رکورد دپلاریزاسیون دهلیزی به عنوان موج P دهلیزی شناخته میشود.
Repolarization of the Atria-the Atrial T Wave. Spread of depolarization through the atrial muscle is much slower than in the ventricles because the atria have no Purkinje system for fast conduction of the depolarization signal. Therefore, the musculature around the sinus node becomes depolarized a long time before the musculature in distal parts of the atria. Consequently, the area in the atria that also becomes repolarized first is the sinus nodal region, the area that had originally become depolarized first.
رپولاریزاسیون دهلیز-موج T دهلیزی. گسترش دپلاریزاسیون از طریق عضله دهلیزی بسیار کندتر از بطنها است زیرا دهلیزها فاقد سیستم پورکنژ برای انتقال سریع سیگنال دپلاریزاسیون هستند. بنابراین، عضله اطراف گره سینوسی مدت زیادی قبل از عضله در قسمتهای انتهایی دهلیزها دپلاریزه میشود. در نتیجه، ناحیه ای در دهلیزها که ابتدا رپلاریزه میشود، ناحیه گره سینوسی است، ناحیه ای که ابتدا دپلاریزه شده بود.
Thus, when repolarization begins, the region around the sinus node becomes positive with respect to the remainder of the atria. Therefore, the atrial repolarization vector is backward to the vector of depolarization. (Note that this is opposite to the effect that occurs in the ventricles.) There- fore, as shown to the right in Figure 12-9, the so-called atrial T wave follows about 0.15 second after the atrial P wave, but this T wave is on the opposite side of the zero reference line from the P wave; that is, it is normally negative rather than positive in the three standard bipolar limb leads.
بنابراین، هنگامیکه رپلاریزاسیون شروع میشود، ناحیه اطراف گره سینوسی نسبت به باقیمانده دهلیزها مثبت میشود. بنابراین، بردار رپلاریزاسیون دهلیزی نسبت به بردار دپلاریزاسیون عقب است. (توجه داشته باشید که این برخلاف اثری است که در بطنها رخ میدهد.) بنابراین، همانطور که در شکل 12-9 در سمت راست نشان داده شده است، به اصطلاح موج T دهلیزی حدود 0.15 ثانیه پس از موج P دهلیزی دنبال میشود، اما این موج T در سمت مخالف خط مرجع صفر از موج P قرار دارد. یعنی معمولاً در سه لید استاندارد اندام دوقطبی به جای مثبت منفی است.
In a normal ECG, the atrial T wave appears at about the same time that the QRS complex of the ventricles appears. Therefore, it is almost always totally obscured by the large ventricular QRS complex, although in some very abnormal states it does appear in the recorded ECG.
Vectorcardiogram
As noted previously, the vector of current flow through the heart changes rapidly as the impulse spreads through the myocardium. It changes in two aspects. First, the vector increases and decreases in length because of increasing and decreasing voltage of the vector. Second, the vector changes direction because of changes in the average direction of the electrical potential from the heart. The vectorcardiogram depicts these changes at different times during the cardiac cycle, as shown in Figure 12-10.
وکتور کاردیوگرام
همانطور که قبلاً ذکر شد، بردار جریان جریان از طریق قلب به سرعت تغییر میکند، زیرا تکانه از طریق میوکارد پخش میشود. از دو جنبه تغییر میکند. اولاً، بردار به دلیل افزایش و کاهش ولتاژ بردار از نظر طول افزایش و کاهش مییابد. دوم، بردار تغییر جهت میدهد به دلیل تغییر در جهت میانگین پتانسیل الکتریکی از قلب. وکتورکاردیوگرام این تغییرات را در زمانهای مختلف در طول چرخه قلبی به تصویر میکشد، همانطور که در شکل 12-10 نشان داده شده است.
In the large vectorcardiogram of Figure 12-10, point 5 is the zero reference point, and this point is the negative end of all the successive vectors. While the heart muscle is polarized between heartbeats, the positive end of the vector remains at the zero point because there is no vectorial electrical potential. However, as soon as current begins to flow through the ventricles at the beginning of ventricular depolarization, the positive end of the vector leaves the zero reference point.
در وکتور کاردیوگرام بزرگ شکل 12-10، نقطه 5 نقطه مرجع صفر است و این نقطه انتهای منفی تمام بردارهای متوالی است. در حالی که عضله قلب بین ضربانهای قلب قطبی میشود، انتهای مثبت بردار در نقطه صفر باقی میماند زیرا پتانسیل الکتریکی برداری وجود ندارد. با این حال، به محض اینکه جریان در ابتدای دپلاریزاسیون بطن از بطنها عبور کند، انتهای مثبت بردار از نقطه مرجع صفر خارج میشود.
When the septum first becomes depolarized, the vector extends downward toward the apex of the ventricles, but it is relatively weak, thus generating the first portion of the ventricular vectorcardiogram, as shown by the positive end of vector 1. As more of the ventricular muscle becomes depolarized, the vector becomes stronger and stronger, usually swinging slightly to one side. Thus, vector 2 of Figure 12- 10 represents the state of depolarization of the ventricles about 0.02 second after vector 1. After another 0.02 second, vector 3 represents the potential, and vector 4 occurs in another 0.01 second. Finally, the ventricles become totally depolarized, and the vector becomes zero once again, as shown at point 5.
هنگامیکه سپتوم برای اولین بار دپلاریزه میشود، وکتور به سمت پایین به سمت راس بطنها امتداد مییابد، اما نسبتا ضعیف است، بنابراین اولین قسمت از وکتور کاردیوگرام بطنی ایجاد میشود، همانطور که با انتهای مثبت بردار 1 نشان داده شده است. هر چه بیشتر عضله بطنی دپلاریزه میشود، بردار کمیقوی تر، به سمت ما قوی تر میشود. بنابراین، بردار 2 از شکل 12-10 نشان دهنده وضعیت دپلاریزاسیون بطنها در حدود 0.02 ثانیه پس از بردار 1 است. پس از 0.02 ثانیه دیگر، بردار 3 نشان دهنده پتانسیل است و بردار 4 در 0.01 ثانیه دیگر رخ میدهد. در نهایت، بطنها کاملاً دپلاریزه میشوند و بردار یک بار دیگر مانند نقطه 5 صفر میشود.
The elliptical figure generated by the positive ends of the vectors is called the QRS vectorcardiogram.
شکل بیضوی ایجاد شده توسط انتهای مثبت بردارها وکتور کاردیوگرام QRS نامیده میشود.
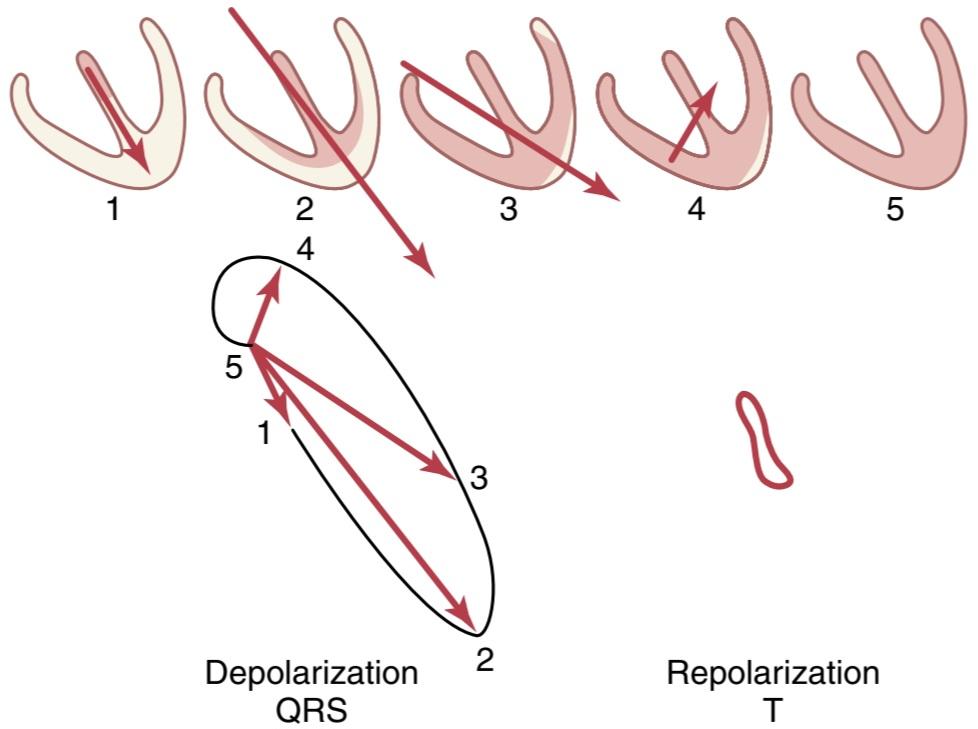
Figure 12-10 QRS and T vectorcardiograms.
شکل 12-10 کاردیوگرامهای QRS و T vector.
MEAN ELECTRICAL AXIS OF THE VENTRICULAR QRS AND ITS SIGNIFICANCE
The vectorcardiogram during ventricular depolarization (the QRS vectorcardiogram) shown in Figure 12-10 is that of a normal heart. Note that during most of the cycle of ventricular depolarization, the direction of the electrical potential (negative to positive) is from the base of the ventricles toward the apex. This preponderant direction of the potential during depolarization from the base to the apex of the heart is called the mean electrical axis of the ventricles. The mean electrical axis of the normal ventricles is 59 degrees. In many pathological conditions of the heart, this direction changes markedly, sometimes even to opposite poles of the heart.
میانگین محور الکتریکی QRS بطنی و اهمیت آن
وکتور کاردیوگرام در طول دپلاریزاسیون بطنی (بردار کاردیوگرام QRS) که در شکل 12-10 نشان داده شده است، مربوط به یک قلب طبیعی است. توجه داشته باشید که در بیشتر چرخه دپلاریزاسیون بطن، جهت پتانسیل الکتریکی (منفی به مثبت) از قاعده بطنها به سمت راس است. این جهت غالب پتانسیل در حین دپلاریزاسیون از قاعده تا راس قلب، محور الکتریکی متوسط بطنها نامیده میشود. میانگین محور الکتریکی بطنهای طبیعی 59 درجه است. در بسیاری از شرایط پاتولوژیک قلب، این جهت به طور قابل توجهی تغییر میکند، گاهی اوقات حتی به قطبهای مخالف قلب.

Figure 12-11 Plotting the mean electrical axis of the ventricles from two electrocardiographic leads (leads I and III).
شکل 12-11 ترسیم میانگین محور الکتریکی بطنها از دو لید الکتروکاردیوگرافی (سرنخ I و III).
DETERMINING THE ELECTRICAL AXIS FROM STANDARD LEAD ELECTROCARDIOGRAMS
Clinically, the electrical axis of the heart is usually estimated from the standard bipolar limb lead ECGs rather than from the vectorcardiogram. Figure 12-11 shows a method for performing this estimation. After recording the standard leads, one determines the net potential and polarity of the recordings in leads I and III. In lead I of Figure 12-11, the recording is positive, and in lead III, the recording is mainly positive but negative during part of the cycle. If any part of a recording is negative, this negative potential is subtracted from the positive part of the potential to determine the net potential for that lead, as shown by the arrow to the right of the QRS complex for lead III. Then, each net potential for leads I and III is plotted on the axes of the respective leads, with the base of the potential at the point of intersection of the axes, as shown in Figure 12-11.
تعیین محور الکتریکی از الکتروکاردیوگرامهای استاندارد لید
از نظر بالینی، محور الکتریکی قلب معمولاً از ECGهای استاندارد دوقطبی لید اندام به جای بردار کاردیوگرام تخمین زده میشود. شکل 12-11 روشی را برای انجام این تخمین نشان میدهد. پس از ضبط لیدهای استاندارد، پتانسیل خالص و قطبیت ضبط در لیدهای I و III تعیین میشود. در لید I شکل 12-11، ضبط مثبت است و در لید III، ضبط عمدتاً مثبت است اما در بخشی از چرخه منفی است. اگر هر بخشی از ضبط منفی باشد، این پتانسیل منفی از قسمت مثبت پتانسیل برای تعیین پتانسیل خالص برای آن لید کم میشود، همانطور که با فلش سمت راست مجتمع QRS برای لید III نشان داده شده است. سپس، هر پتانسیل خالص برای لیدهای I و III بر روی محورهای لیدهای مربوطه، با پایه پتانسیل در نقطه تقاطع محورها، همانطور که در شکل 12-11 نشان داده شده است، ترسیم میشود.
To determine the vector of the total QRS ventricular mean electrical potential, one draws perpendicular lines (the dashed lines in the figure) from the apices of leads I and III, respectively. The point of intersection of these two perpendicular (dashed) lines represents, by vectorial analysis, the apex of the mean QRS vector in the ventricles, and the point of intersection of the lead I and lead III axes represents the negative end of the mean vector. Therefore, the mean QRS vector is drawn between these two points. The approximate average potential generated by the ventricles during depolarization is represented by the length of this mean QRS vector, and the mean electrical axis is represented by the direction of the mean vector. Thus, the orientation of the mean electrical axis of the normal ventricles, as determined in Figure 12-11, is 59 degrees positive (+59 degrees).
برای تعیین بردار پتانسیل الکتریکی میانگین بطن QRS، خطوط عمودی (خطوط چین در شکل) به ترتیب از رأس لیدهای I و III ترسیم میشود. نقطه تقاطع این دو خط عمود بر هم با تحلیل برداری، راس بردار QRS متوسط در بطنها را نشان میدهد و نقطه تلاقی محورهای لید I و لید III نشان دهنده انتهای منفی بردار میانگین است. بنابراین بردار QRS میانگین بین این دو نقطه رسم میشود. میانگین تقریبی پتانسیل تولید شده توسط بطنها در طول دپلاریزاسیون با طول بردار QRS متوسط نشان داده میشود و میانگین محور الکتریکی با جهت بردار متوسط نشان داده میشود. بنابراین، جهت گیری میانگین محور الکتریکی بطنهای نرمال، همانطور که در شکل 12-11 مشخص شده است، 59 درجه مثبت (59+ درجه) است.
ABNORMAL VENTRICULAR CONDITIONS THAT CAUSE AXIS DEVIATION
Although the mean electrical axis of the ventricles aver- ages about 59 degrees, this axis can swing, even in a normal heart, from about 20 degrees to about 100 degrees. The causes of the normal variations are mainly anatomical differences in the Purkinje distribution system or in the musculature itself of different hearts. However, a number of abnormal conditions of the heart can cause axis deviation beyond the normal limits, as described below.
شرایط غیر طبیعی بطنی که باعث انحراف محور میشود
اگرچه میانگین محور الکتریکی بطنها به طور متوسط حدود 59 درجه است، این محور میتواند حتی در یک قلب طبیعی از حدود 20 درجه به حدود 100 درجه نوسان کند. علل تغییرات طبیعی عمدتاً تفاوتهای آناتومیکی در سیستم توزیع پورکنژ یا در خود ماهیچه قلبهای مختلف است. با این حال، تعدادی از شرایط غیر طبیعی قلب میتواند باعث انحراف محور فراتر از حد طبیعی شود، همانطور که در زیر توضیح داده شده است.
Change in the Position of the Heart in the Chest. If the heart is angulated to the left, the mean electrical axis of the heart also shifts to the left. Such shift occurs (1) at the end of deep expiration, (2) when a person lies down, because the abdominal contents press upward against the diaphragm, and (3) quite frequently in obese people, whose diaphragms normally press upward against the heart all the time as a result of increased visceral adiposity.
تغییر در موقعیت قلب در قفسه سینه. اگر قلب به سمت چپ زاویه داشته باشد، میانگین محور الکتریکی قلب نیز به سمت چپ تغییر میکند. چنین تغییری (1) در پایان بازدم عمیق، (2) زمانی که فرد دراز میکشد، زیرا محتویات شکم به دیافراگم به سمت بالا فشار میآورد، و (3) اغلب در افراد چاق که معمولاً دیافراگمهایشان در نتیجه افزایش چاقی احشایی همیشه به سمت بالا به قلب فشار میآورد، رخ میدهد.
Likewise, angulation of the heart to the right causes the mean electrical axis of the ventricles to shift to the right. This shift occurs (1) at the end of deep inspiration, (2) when a person stands up, and (3) normally in tall lanky people whose hearts hang downward.
به همین ترتیب، زاویه قلب به سمت راست باعث میشود که محور الکتریکی متوسط بطنها به سمت راست تغییر کند. این جابجایی (1) در پایان الهام عمیق، (2) زمانی که یک فرد میایستد، و (3) به طور معمول در افراد لاغر اندام بلند قد که قلبشان به سمت پایین آویزان است، رخ میدهد.
Hypertrophy of One Ventricle. When one ventricle hypertrophies greatly, the axis of the heart shifts toward the hypertrophied ventricle for two reasons. First, there is more muscle on the hypertrophied side of the heart than on the other side, which allows for the generation of greater electrical potential on that side. Second, more time is required for the depolarization wave to travel through the hypertrophied ventricle than through the normal ventricle. Consequently, the normal ventricle becomes depolarized considerably in advance of the hypertrophied ventricle, and this situation causes a strong vector from the normal side of the heart toward the hypertrophied side, which remains strongly positively charged. Thus, the axis deviates toward the hypertrophied ventricle.
هیپرتروفی یک بطن. هنگامیکه یک بطن به شدت هیپرتروفی میکند، محور قلب به دو دلیل به سمت بطن هیپرتروفی شده تغییر میکند. اول اینکه در سمت هیپرتروفی شده قلب نسبت به طرف دیگر عضله بیشتری وجود دارد که امکان تولید پتانسیل الکتریکی بیشتری را در آن سمت فراهم میکند. دوم، زمان بیشتری برای عبور موج دپلاریزاسیون از بطن هیپرتروفی شده نسبت به بطن طبیعی لازم است. در نتیجه، بطن طبیعی به طور قابل توجهی پیش از بطن هیپرتروفی شده دپلاریزه میشود و این وضعیت باعث ایجاد یک ناقل قوی از سمت طبیعی قلب به سمت سمت هیپرتروفی شده میشود که به شدت باردار مثبت باقی میماند. بنابراین، محور به سمت بطن هیپرتروفی شده منحرف میشود.
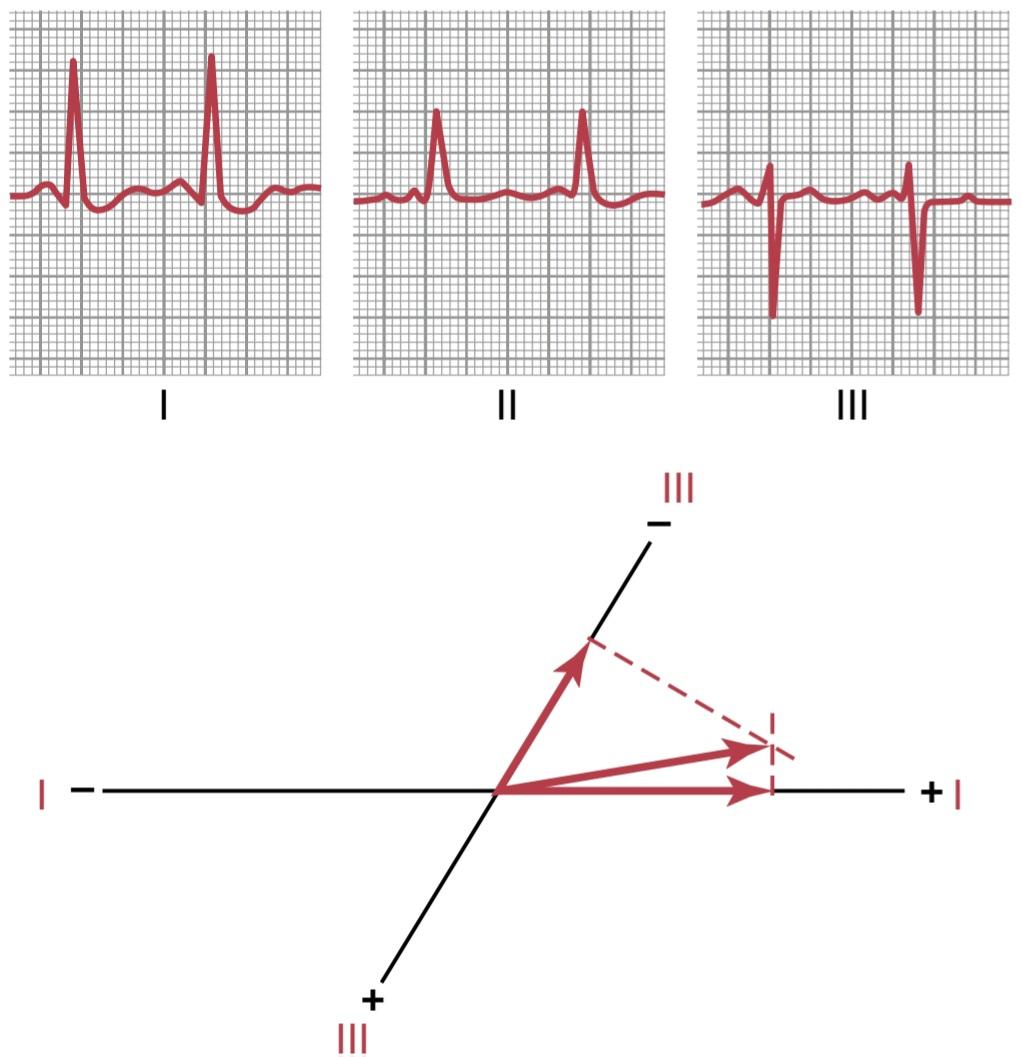
Figure 12-12 Left axis deviation in a hypertensive heart (hypertrophic left ventricle). Note the slightly prolonged QRS complex as well.
شکل 12-12 انحراف محور چپ در قلب پرفشار خون (بطن چپ هیپرتروفیک). به کمپلکس QRS کمیطولانی نیز توجه کنید.
Vectorial Analysis of Left Axis Deviation Resulting from Hypertrophy of the Left Ventricle. Figure 12-12 shows the three standard bipolar limb lead ECGs. Vectorial analysis demonstrates left axis deviation, with the mean electrical axis pointing in the -15-degree direction. This is a typical ECG caused by increased muscle mass of the left ventricle. In this case, the axis deviation was caused by hypertension (high arterial blood pressure), which caused the left ventricle to hypertrophy so that it could pump blood against elevated systemic arterial pressure. A similar picture of left axis deviation occurs when the left ventricle hypertrophies as a result of aortic valvular stenosis, aortic valvular regurgitation, or congenital heart conditions in which the left ventricle enlarges while the right ventricle remains relatively normal in size.
تحلیل برداری انحراف محور چپ ناشی از هیپرتروفی بطن چپ. شکل 12-12 سه ECG استاندارد دوقطبی لید اندام را نشان میدهد. تجزیه و تحلیل برداری، انحراف محور چپ را نشان میدهد، با میانگین محور الکتریکی که در جهت 15- درجه است. این یک ECG معمولی است که به دلیل افزایش توده عضلانی بطن چپ ایجاد میشود. در این مورد، انحراف محور ناشی از فشار خون بالا (فشار خون شریانی بالا) است که باعث هیپرتروفی بطن چپ میشود تا بتواند خون را در برابر فشار شریانی سیستمیک بالا پمپاژ کند. تصویر مشابهی از انحراف محور چپ زمانی رخ میدهد که بطن چپ در نتیجه تنگی دریچه آئورت، نارسایی دریچه آئورت یا شرایط مادرزادی قلب که در آن بطن چپ بزرگ میشود در حالی که بطن راست از نظر اندازه نسبتاً طبیعی باقی میماند، هیپرتروفی میشود.
Vectorial Analysis of Right Axis Deviation Resulting from Hypertrophy of the Right Ventricle. The ECG of Figure 12-13 shows intense right axis deviation, to an electrical axis of 170 degrees, which is 111 degrees to the right of the normal 59-degree mean ventricular QRS axis. The right axis deviation demonstrated in this figure was caused by hypertrophy of the right ventricle as a result of congenital pulmonary valve stenosis. Right axis deviation also can occur in other congenital heart conditions that cause hypertrophy of the right ventricle, such as tetralogy of Fallot and interventricular septal defect.
تحلیل برداری انحراف محور راست ناشی از هیپرتروفی بطن راست. ECG شکل 12-13 انحراف شدید محور راست را به یک محور الکتریکی 170 درجه نشان میدهد که 111 درجه به سمت راست از میانگین بطن بطنی 59 درجه عادی محور QRS است. انحراف محور راست نشان داده شده در این شکل ناشی از هیپرتروفی بطن راست در نتیجه تنگی مادرزادی دریچه ریوی است. انحراف محور راست همچنین میتواند در سایر بیماریهای مادرزادی قلب که باعث هیپرتروفی بطن راست میشود، مانند تترالوژی فالوت و نقص دیواره بین بطنی رخ دهد.

Figure 12-13 A high-voltage electrocardiogram for a person with congenital pulmonary valve stenosis with right ventricular hypertrophy. Intense right axis deviation and a slightly prolonged QRS complex are also seen.
شکل 12-13 یک الکتروکاردیوگرام با ولتاژ بالا برای یک فرد مبتلا به تنگی مادرزادی دریچه ریوی با هیپرتروفی بطن راست. انحراف شدید محور راست و یک کمپلکس QRS کمیطولانی نیز دیده میشود.
Bundle Branch Block Causes Axis Deviation. Ordinarily, the lateral walls of the two ventricles depolarize at almost the same instant because both the left and right bundle branches of the Purkinje system transmit the cardiac impulse to the two ventricular walls at almost the same time. As a result, the potentials generated by the two ventricles (on the two opposite sides of the heart) almost neutralize each other. However, if only one of the major bundle branches is blocked, the cardiac impulse spreads through the normal ventricle before it spreads through the other ventricle. Therefore, depolarization of the two ventricles does not occur, even nearly at the same time, and the depolarization potentials do not neutralize each other. As a result, axis deviation occurs as follows.
بلوک شاخه بسته نرم افزاری باعث انحراف محور میشود. معمولاً دیوارههای جانبی دو بطن تقریباً در یک لحظه دپلاریزه میشوند، زیرا هر دو شاخه چپ و راست سیستم پورکنژ، تکانههای قلبی را تقریباً همزمان به دو دیواره بطن منتقل میکنند. در نتیجه پتانسیلهای ایجاد شده توسط دو بطن (در دو طرف مقابل قلب) تقریباً یکدیگر را خنثی میکنند. با این حال، اگر فقط یکی از شاخههای اصلی بسته شود، تکانه قلبی قبل از اینکه از طریق بطن دیگر پخش شود، از طریق بطن طبیعی پخش میشود. بنابراین دپلاریزاسیون دو بطن حتی تقریباً همزمان اتفاق نمیافتد و پتانسیلهای دپلاریزاسیون یکدیگر را خنثی نمیکنند. در نتیجه انحراف محور به صورت زیر رخ میدهد.
Vectorial Analysis of Left Axis Deviation in Left Bundle Branch Block. When the left bundle branch is blocked, cardiac depolarization spreads through the right ventricle two to three times as rapidly as through the left ventricle. Consequently, much of the left ventricle remains polarized for as long as 0.1 second after the right ventricle has become totally depolarized. Thus, the right ventricle becomes electronegative, whereas the left ventricle remains electropositive during most of the depolarization process, and a strong vector projects from the right ventricle toward the left ventricle. In other words, intense left axis deviation of about -50 degrees occurs because the positive end of the vector points toward the left ventricle. This situation is demonstrated in Figure 12-14, which shows typical left axis deviation resulting from left bundle branch block.
تحلیل برداری انحراف محور چپ در بلوک شاخه چپ. هنگامیکه شاخه چپ بسته میشود، دپلاریزاسیون قلب از طریق بطن راست دو تا سه برابر سریعتر از بطن چپ پخش میشود. در نتیجه، بیشتر بطن چپ تا 0.1 ثانیه پس از دپلاریزه شدن کامل بطن راست، قطبی میماند. بنابراین، بطن راست الکترونگاتیو میشود، در حالی که بطن چپ در بیشتر مراحل دپلاریزاسیون الکترومثبت باقی میماند و یک بردار قوی از بطن راست به سمت بطن چپ پیش میرود. به عبارت دیگر، انحراف شدید محور چپ در حدود -50 درجه رخ میدهد زیرا انتهای مثبت بردار به سمت بطن چپ است. این وضعیت در شکل 12-14 نشان داده شده است که انحراف معمولی محور چپ ناشی از بلوک شاخه چپ را نشان میدهد.
Because of slowness of impulse conduction when the Purkinje system is blocked, in addition to axis deviation, the duration of the QRS complex is greatly pro- longed as a result of extreme slowness of depolarization in the affected side of the heart. One can see this effect by observing the excessive widths of the QRS waves in Figure 12-14 (discussed in greater detail later in this chapter). This extremely prolonged QRS complex differentiates bundle branch block from axis deviation caused by hypertrophy.
به دلیل کندی رسانش ضربه در هنگام مسدود شدن سیستم پورکنژ، علاوه بر انحراف محور، مدت زمان کمپلکس QRS در نتیجه کندی شدید دپلاریزاسیون در سمت آسیبدیده قلب، بسیار طولانیتر میشود. میتوان این اثر را با مشاهده پهنای بیش از حد امواج QRS در شکل 12-14 مشاهده کرد (که در ادامه این فصل با جزئیات بیشتر مورد بحث قرار خواهد گرفت). این کمپلکس بسیار طولانی QRS بلوک شاخه بسته را از انحراف محور ناشی از هیپرتروفی متمایز میکند.

Figure 12-14 Left axis deviation caused by left bundle branch block. Note also the greatly prolonged QRS complex.
شکل 12-14 انحراف محور چپ ناشی از بلوک شاخه چپ. همچنین به کمپلکس بسیار طولانی QRS توجه کنید.
Vectorial Analysis of Right Axis Deviation in Right Bundle Branch Block. When the right bundle branch is blocked, the left ventricle depolarizes far more rapidly than the right ventricle, and thus the left side of the ventricles becomes electronegative as long as 0.1 second before the right. Therefore, a strong vector develops, with its negative end toward the left ventricle and its positive end toward the right ventricle. In other words, intense right axis deviation occurs. In Figure 12-15, right axis deviation caused by right bundle branch block is demonstrated, and its vector is analyzed; this analysis shows an axis of about 105 degrees instead of the normal 59 degrees and a prolonged QRS complex because of slow conduction.
تحلیل برداری انحراف محور راست در بلوک شاخه راست. هنگامیکه شاخه سمت راست مسدود میشود، بطن چپ به مراتب سریعتر از بطن راست دپلاریزه میشود و در نتیجه سمت چپ بطن تا 0.1 ثانیه قبل از بطن راست الکترونگاتیو میشود. بنابراین، یک بردار قوی ایجاد میشود که انتهای منفی آن به سمت بطن چپ و انتهای مثبت آن به سمت بطن راست است. به عبارت دیگر، انحراف شدید محور راست رخ میدهد. در شکل 12-15، انحراف محور سمت راست ناشی از بلوک شاخه راست نشان داده شده و بردار آن تحلیل شده است. این تحلیل یک محور حدود 105 درجه را به جای 59 درجه معمولی و یک کمپلکس طولانی مدت QRS را به دلیل هدایت کند نشان میدهد.
CONDITIONS THAT CAUSE ABNORMAL VOLTAGES OF THE QRS COMPLEX
INCREASED VOLTAGE IN THE STANDARD BIPOLAR LIMB LEADS
Normally, the voltages in the three standard bipolar limb leads, as measured from the peak of the R wave to the bottom of the S wave, vary between 0.5 and 2.0 millivolts, with lead III usually recording the lowest voltage and lead II the highest voltage. However, these relationships are not invariable, even for the normal heart. In general, when the sum of the voltages of all the QRS complexes of the three standard leads is greater than 4 millivolts, the patient is considered to have a high-voltage ECG.
شرایطی که باعث ایجاد ولتاژهای غیرعادی مجتمع QRS میشود
افزایش ولتاژ در سرنخهای استاندارد دوقطبی اندام
به طور معمول، ولتاژ در سه لید استاندارد دوقطبی، همانطور که از اوج موج R تا انتهای موج S اندازه گیری میشود، بین 0.5 تا 2.0 میلی ولت متغیر است، که لید III معمولاً کمترین ولتاژ و لید II بالاترین ولتاژ را ثبت میکند. با این حال، این روابط تغییر ناپذیر نیست، حتی برای قلب عادی. به طور کلی وقتی مجموع ولتاژهای تمام کمپلکسهای QRS سه لید استاندارد بیشتر از 4 میلی ولت باشد، بیمار دارای ECG ولتاژ بالا در نظر گرفته میشود.
The cause of high-voltage QRS complexes is usu- ally increased muscle mass of the heart, which ordinarily results from hypertrophy of the muscle in response to excessive load on one part of the heart or the other. For example, the right ventricle hypertrophies when it must pump blood through a stenotic pulmonary valve or when the pulmonary arterial pressure is elevated, and the left ventricle hypertrophies when a person has high systemic arterial blood pressure. The increased quantity of muscle generates increased electricity around the heart. As a result, the electrical potentials recorded in the electrocar- diographic leads are considerably greater than normal, as shown in Figures 12-12 and 12-13.
علت کمپلکسهای ولتاژ بالا QRS معمولاً افزایش توده عضلانی قلب است که معمولاً از هیپرتروفی عضله در پاسخ به بار بیش از حد بر روی یک قسمت از قلب یا قسمت دیگر ناشی میشود. به عنوان مثال، زمانی که بطن راست باید خون را از طریق یک دریچه تنگی ریوی پمپاژ کند یا فشار شریانی ریوی بالا میرود هیپرتروفی میشود و زمانی که فرد فشار خون شریانی سیستمیک بالا دارد، بطن چپ هیپرتروفی میشود. افزایش مقدار ماهیچه باعث افزایش الکتریسیته در اطراف قلب میشود. در نتیجه، پتانسیلهای الکتریکی ثبت شده در لیدهای الکتروکاردیوگرافی به طور قابل توجهی بیشتر از حالت عادی است، همانطور که در شکلهای 12-12 و 12-13 نشان داده شده است.

Figure 12-15 Right axis deviation caused by right bundle branch block. Note also the greatly prolonged QRS complex.
شکل 12-15 انحراف محور راست ناشی از بلوک شاخه راست. همچنین به کمپلکس بسیار طولانی QRS توجه کنید.
DECREASED VOLTAGE OF THE ELECTROCARDIOGRAM
کاهش ولتاژ الکتروکاردیوگرام
Decreased Voltage Caused by Cardiac Myopathies. One of the most common causes of decreased voltage of the QRS complex is a series of old myocardial infarctions with resultant diminished muscle mass. This condition also causes the depolarization wave to move through the ventricles slowly and prevents major portions of the heart from becoming massively depolarized all at once. Consequently, this condition causes some prolongation of the QRS complex, along with the decreased voltage. Figure 12-16 shows a typical low- voltage ECG with prolongation of the QRS complex, which is common after multiple small infarctions of the heart have caused local delays of impulse conduction and reduced voltages due to loss of muscle mass throughout the ventricles. Infiltrative myocardial diseases also cause low ECG voltage. For example, in cardiac amyloidosis, abnormal proteins infiltrate the myocardium, leading to reduced voltages, particularly in the limb leads.
کاهش ولتاژ ناشی از میوپاتی قلبی. یکی از شایعترین علل کاهش ولتاژ کمپلکس QRS، یک سری انفارکتوسهای قدیمیمیوکارد با کاهش توده عضلانی است. این وضعیت همچنین باعث میشود که موج دپلاریزاسیون به آرامیدر بطنها حرکت کند و از دپلاریزه شدن شدید بخشهای اصلی قلب به یکباره جلوگیری میکند. در نتیجه، این وضعیت باعث طولانی شدن کمپلکس QRS به همراه کاهش ولتاژ میشود. شکل 12-16 یک ECG ولتاژ پایین معمولی با طولانی شدن کمپلکس QRS را نشان میدهد، که پس از انفارکتوسهای کوچک متعدد قلب که باعث تأخیر موضعی در رسانش ضربه و کاهش ولتاژ به دلیل از دست دادن توده عضلانی در سراسر بطن شده است، شایع است. بیماریهای انفیلتراتیو میوکارد نیز باعث ولتاژ پایین ECG میشوند. برای مثال، در آمیلوئیدوز قلبی، پروتئینهای غیرطبیعی به میوکارد نفوذ میکنند که منجر به کاهش ولتاژ، به ویژه در لیدهای اندام میشود.
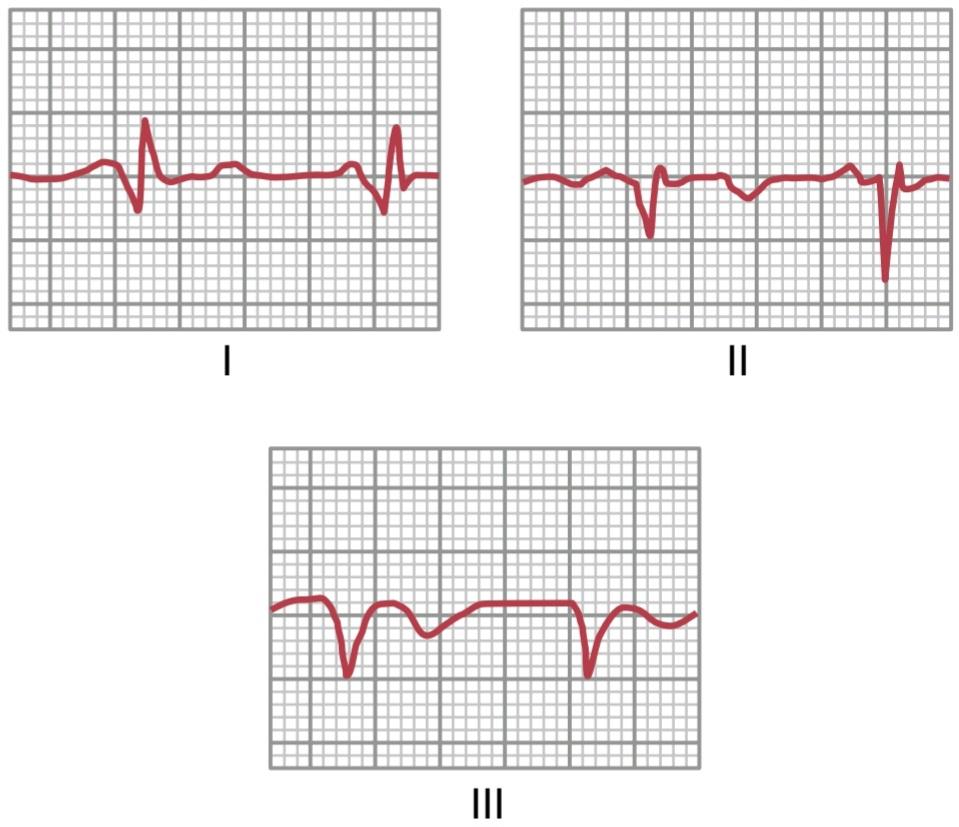
Figure 12-16 A low-voltage electrocardiogram following local damage throughout the ventricles caused by a previous myocardial infarction.
شکل 12-16 یک الکتروکاردیوگرام ولتاژ پایین به دنبال آسیب موضعی در سراسر بطنها ناشی از انفارکتوس میوکارد قبلی.
Decreased Voltage Caused by Conditions Surrounding the Heart. One of the most important causes of decreased voltage in electrocardiographic leads is excessive fluid in the pericardium (pericardial effusion). Because extracellular fluid easily conducts electrical currents, a large portion of the electricity flowing out of the heart is conducted from one part of the heart to another through the pericardial fluid. Thus, this effusion effectively “short-circuits” the electrical potentials generated by the heart, decreasing the electrocardiographic voltages that reach the outside surfaces of the body. Pleural effusion, to a lesser extent, also can short- circuit the electricity around the heart so that the voltages at the surface of the body and in the ECGs are decreased.
کاهش ولتاژ ناشی از شرایط اطراف قلب. یکی از مهم ترین علل کاهش ولتاژ در لیدهای الکتروکاردیوگرافی، وجود مایع بیش از حد در پریکارد (افیوژن پریکارد) است. از آنجایی که مایع خارج سلولی به راحتی جریانهای الکتریکی را هدایت میکند، بخش بزرگی از الکتریسیته ای که از قلب خارج میشود از طریق مایع پریکارد از یک قسمت قلب به قسمت دیگر منتقل میشود. بنابراین، این ترشح به طور موثر پتانسیلهای الکتریکی تولید شده توسط قلب را “مدار کوتاه” میکند و ولتاژهای الکتروکاردیوگرافی را که به سطوح بیرونی بدن میرسد کاهش میدهد. پلورال افیوژن نیز به میزان کمتری میتواند برق اطراف قلب را کوتاه کند تا ولتاژ در سطح بدن و ECG کاهش یابد.
Pulmonary emphysema can decrease the electrocar- diographic potentials, but for a different reason than that of pericardial effusion. In persons with pulmonary emphysema, conduction of electrical current through the lungs is depressed considerably because of an excessive quantity of air in the lungs. Also, the chest cavity enlarges, and the lungs tend to envelop the heart to a greater extent than normal. Therefore, the lungs act as an insulator to prevent the spread of electrical voltage from the heart to the surface of the body, which results in decreased electrocardiographic potentials in the various leads.
آمفیزم ریوی میتواند پتانسیلهای الکتروکاردیوگرافی را کاهش دهد، اما به دلیلی متفاوت از افیوژن پریکارد. در افراد مبتلا به آمفیزم ریوی، به دلیل وجود مقدار بیش از حد هوا در ریهها، رسانش جریان الکتریکی از طریق ریهها به طور قابل توجهی کاهش مییابد. همچنین، حفره قفسه سینه بزرگ میشود و ریهها تمایل دارند قلب را به میزان بیشتری از حالت طبیعی در بر بگیرند. بنابراین، ریهها به عنوان یک عایق برای جلوگیری از انتشار ولتاژ الکتریکی از قلب به سطح بدن عمل میکنند که منجر به کاهش پتانسیلهای الکتروکاردیوگرافی در لیدهای مختلف میشود.
PROLONGED AND BIZARRE PATTERNS OF THE QRS COMPLEX
CARDIAC HYPERTROPHY OR DILATION PROLONG THE QRS COMPLEX
The QRS complex lasts as long as depolarization continues to spread through the ventricles-that is, as long as part of the ventricles is depolarized and part is still polarized. Therefore, prolonged conduction of the impulse through the ventricles always causes a prolonged QRS complex. Such prolongation often occurs when one or both ventricles are hypertrophied or dilated because of the longer pathway that the impulse must then travel. The normal QRS complex lasts 0.06 to 0.08 second, whereas in hypertrophy or dilation of the left or right ventricle, the QRS complex may be prolonged to 0.09 to 0.12 second.
الگوهای طولانی و عجیب و غریب مجتمع QRS
هیپرتروفی یا اتساع قلب باعث طولانی شدن کمپلکس QRS میشود
کمپلکس QRS تا زمانی که دپلاریزاسیون از طریق بطنها پخش میشود ادامه مییابد، یعنی تا زمانی که بخشی از بطنها دپلاریزه و بخشی هنوز قطبی شده است. بنابراین، هدایت طولانیمدت ایمپالس از طریق بطنها همیشه باعث طولانی شدن کمپلکس QRS میشود. چنین طولانی شدنی اغلب زمانی اتفاق میافتد که یک یا هر دو بطن هیپرتروفی یا گشاد میشوند، زیرا مسیر طولانیتری که تکانه باید طی کند. کمپلکس طبیعی QRS 0.06 تا 0.08 ثانیه طول میکشد، در حالی که در هیپرتروفی یا اتساع بطن چپ یا راست، کمپلکس QRS ممکن است تا 0.09 تا 0.12 ثانیه طولانی شود.
PURKINJE SYSTEM BLOCK PROLONGS THE QRS COMPLEX
When the Purkinje fibers are blocked, the cardiac impulse must then be conducted by the ventricular muscle instead of through the Purkinje system. This action decreases the velocity of impulse conduction to about onethird of normal. Therefore, if complete block of one of the bundle branches occurs, the duration of the QRS complex is usu- ally increased to 0.14 second or longer.
بلوک سیستم پورکینج مجتمع QRS را طولانی میکند
هنگامیکه فیبرهای پورکنژ مسدود میشوند، تکانه قلبی باید به جای سیستم پورکنژ توسط عضله بطنی هدایت شود. این عمل سرعت هدایت ضربه را به حدود یک سوم نرمال کاهش میدهد. بنابراین، اگر بلوک کامل یکی از شاخههای باندل رخ دهد، مدت زمان کمپلکس QRS معمولاً به 0.14 ثانیه یا بیشتر افزایش مییابد.
In general, a QRS complex is considered to be abnormally long when it lasts more than 0.09 second. When it lasts more than 0.12 second, the prolongation is almost certainly caused by a pathological block some- where in the ventricular conduction system, as shown by the ECGs for bundle branch block in Figures. 12-14 and 12-15.
به طور کلی، یک کمپلکس QRS زمانی که بیش از 0.09 ثانیه طول بکشد به طور غیر طبیعی طولانی در نظر گرفته میشود. هنگامیکه بیش از 0.12 ثانیه طول بکشد، طولانی شدن تقریباً به طور قطع توسط یک بلوک پاتولوژیک در جایی در سیستم هدایت بطنی ایجاد میشود، همانطور که توسط ECG برای بلوک شاخه بسته در شکلها نشان داده شده است. 12-14 و 12-15.
CONDITIONS THAT CAUSE BIZARRE QRS COMPLEXES
Bizarre patterns of the QRS complex are usually caused by two conditions: (1) destruction of cardiac muscle in various areas throughout the ventricular system, with replacement of this muscle by scar tissue; and (2) multiple small local blocks in the conduction of impulses at many points in the Purkinje system. As a result, cardiac impulse conduction becomes irregular, causing rapid shifts in voltages and axis deviations. This irregularity often causes double or even triple peaks in some of the electrocardiographic leads, such as those shown in Figure 12-14.
شرایطی که باعث ایجاد مجتمعهای QRS عجیب و غریب میشود
الگوهای عجیب و غریب کمپلکس QRS معمولاً توسط دو حالت ایجاد میشود: (1) تخریب عضله قلب در نواحی مختلف در سراسر سیستم بطنی، با جایگزینی این عضله با بافت اسکار. و (2) بلوکهای کوچک محلی متعدد در هدایت تکانهها در بسیاری از نقاط در سیستم پورکنژ. در نتیجه، هدایت ضربان قلب نامنظم میشود و باعث جابجایی سریع در ولتاژها و انحرافات محور میشود. این بی نظمیاغلب باعث ایجاد پیکهای مضاعف یا حتی سه گانه در برخی از لیدهای الکتروکاردیوگرافی میشود، مانند آنچه در شکل 12-14 نشان داده شده است.
CURRENT OF INJURY
Many different cardiac abnormalities, especially those that damage the heart muscle, may cause part of the heart to remain partially or totally depolarized all the time. When this condition occurs, current flows between the pathologically depolarized and normally polarized areas, even between heartbeats. This condition is called a current of injury. Note especially that the injured part of the heart is negative, because this is the part that is depolarized and emits negative charges into the surrounding fluids, whereas the remainder of the heart is neutral or in positive polarity.
جریان جراحت
بسیاری از ناهنجاریهای قلبی مختلف، بهویژه آنهایی که به عضله قلب آسیب میرسانند، ممکن است باعث شوند بخشی از قلب همیشه به طور جزئی یا کاملاً دپلاریزه باقی بماند. هنگامیکه این وضعیت رخ میدهد، جریان بین نواحی پاتولوژیک دپلاریزه شده و معمولاً قطبی شده، حتی بین ضربان قلب جریان مییابد. این حالت جریان آسیب نامیده میشود. به خصوص توجه داشته باشید که قسمت آسیب دیده قلب منفی است، زیرا این قسمتی است که دپلاریزه شده و بارهای منفی را به مایعات اطراف ساطع میکند، در حالی که باقی مانده قلب خنثی یا در قطب مثبت است.
Some abnormalities that can cause a current of injury are as follows: (1) mechanical trauma, which sometimes makes the membranes remain so permeable that full repolarization cannot take place; (2) infectious processes that damage the muscle membranes; and (3) ischemia of local areas of heart muscle caused by local coronary occlusions, which is the most common cause of a current of injury in the heart. During ischemia, not enough nutrients from the coronary blood supply are available to the heart muscle to maintain normal membrane polarization.
برخی از ناهنجاریهایی که میتوانند باعث جریان آسیب شوند به شرح زیر است: (1) ضربه مکانیکی، که گاهی باعث میشود غشاها چنان نفوذپذیر باقی بمانند که رپلاریزاسیون کامل انجام نشود. (2) فرآیندهای عفونی که به غشای عضلانی آسیب میرساند. و (3) ایسکمینواحی موضعی عضله قلب ناشی از انسداد موضعی کرونری است که شایعترین علت جریان آسیب در قلب است. در طول ایسکمی، مواد مغذی کافی از منبع خون کرونری برای حفظ قطبش طبیعی غشاء در دسترس عضله قلب نیست.
EFFECT OF CURRENT OF INJURY ON THE QRS COMPLEX
In Figure 12-17, a small area in the base of the left ventricle is newly infarcted (i.e., there is loss of coronary blood flow). Therefore, during the T-P interval—that is, when the normal ventricular muscle is totally polarized- abnormal negative current still flows from the infarcted area at the base of the left ventricle and spreads toward the rest of the ventricles.
اثر جریان آسیب بر روی کمپلکس QRS
در شکل 12-17، ناحیه کوچکی در قاعده بطن چپ به تازگی دچار انفارکتوس شده است (یعنی از دست دادن جریان خون کرونر وجود دارد). بنابراین، در طول بازه T-P – یعنی زمانی که عضله بطنی طبیعی کاملاً پلاریزه است – جریان منفی غیرطبیعی همچنان از ناحیه انفارکتوس شده در قاعده بطن چپ جریان مییابد و به سمت بقیه بطنها پخش میشود.

Figure 12-17 Effect of a current of injury on the electrocardiogram.
شکل 12-17 تأثیر جریان آسیب بر روی الکتروکاردیوگرام.
The vector of this current of injury, as shown in the first heart in Figure 12-17, is in a direction of about 125 degrees, with the base of the vector, the negative end, toward the injured muscle. As shown in the lower portions of the figure, even before the QRS complex begins, this vector causes an initial record in lead I below the zero potential line, because the projected vector of the current of injury in lead I points toward the negative end of the lead I axis. In lead II, the record is above the line because the projected vector points more toward the positive terminal of the lead. In lead III, the projected vector points in the same direction as the positive terminal of lead III so that the record is positive. Furthermore, because the vector lies almost exactly in the direction of the axis of lead III, the voltage of the current of injury in lead III is much greater than in either lead I or lead II.
بردار این جریان آسیب، همانطور که در قلب اول در شکل 12-17 نشان داده شده است، در جهتی حدود 125 درجه، با قاعده بردار، انتهای منفی، به سمت عضله آسیب دیده است. همانطور که در قسمتهای پایینی شکل نشان داده شده است، حتی قبل از شروع کمپلکس QRS، این بردار باعث یک رکورد اولیه در لید I زیر خط پتانسیل صفر میشود، زیرا بردار پیش بینی شده جریان آسیب در لید I به سمت انتهای منفی محور لید I اشاره میکند. در لید II، رکورد بالای خط است زیرا بردار پیش بینی شده بیشتر به سمت پایانه مثبت لید اشاره میکند. در لید III، بردار پیش بینی شده در همان جهت نقطه مثبت لید III قرار میگیرد تا رکورد مثبت باشد. علاوه بر این، از آنجایی که بردار تقریباً دقیقاً در جهت محور لید III قرار دارد، ولتاژ جریان آسیب در لید III بسیار بیشتر از لید I یا لید II است.
As the heart then proceeds through its normal process of depolarization, the septum first becomes depolarized; then the depolarization spreads down to the apex and back toward the bases of the ventricles. The last portion of the ventricles to become totally depolarized is the base of the right ventricle because the base of the left ventricle is already totally and permanently depolarized. By vectorial analysis, the successive stages of electrocardiographic generation by the depolarization wave traveling through the ventricles can be constructed graphically, as demonstrated in the lower part of Figure 12-17.
هنگامیکه قلب روند طبیعی دپلاریزاسیون خود را طی میکند، سپتوم ابتدا دپلاریزه میشود. سپس دپلاریزاسیون به سمت پایین و به سمت قاعده بطنها گسترش مییابد. آخرین قسمتی از بطنها که کاملاً دپلاریزه میشود، قاعده بطن راست است، زیرا قاعده بطن چپ به طور کامل و دائمیدپلاریزه شده است. با تجزیه و تحلیل برداری، مراحل متوالی تولید الکتروکاردیوگرافی توسط موج دپلاریزاسیون که از بطنها عبور میکند، همانطور که در قسمت پایین شکل 12-17 نشان داده شده است را میتوان به صورت گرافیکی ساخت.
When the heart becomes totally depolarized, at the end of the depolarization process (as noted by the next to last stage in Figure 12-17), all the ventricular muscle is in a negative state. Therefore, at this instant in the ECG, no current flows from the ventricles to the electrocardio- graphic electrodes because now both the injured heart muscle and the contracting muscle are depolarized.
هنگامیکه قلب کاملاً دپلاریزه میشود، در پایان فرآیند دپلاریزاسیون (همانطور که در مرحله بعدی تا آخرین مرحله در شکل 12-17 ذکر شده است)، تمام عضله بطنی در حالت منفی قرار دارد. بنابراین، در این لحظه در ECG، هیچ جریانی از بطنها به الکترودهای الکتروکاردیو گرافی جریان نمییابد، زیرا اکنون هم عضله قلب آسیب دیده و هم عضله منقبض شده دپلاریزه شده اند.
Next, as repolarization takes place, all the heart finally repolarizes, except the area of permanent depolarization in the injured base of the left ventricle. Thus, repolarization causes a return of the current of injury in each lead, as noted at the far right in Figure 12-17.
در مرحله بعد، با انجام رپلاریزاسیون، تمام قلب در نهایت رپلاریزه میشود، به جز ناحیه دپلاریزاسیون دائمیدر قاعده آسیب دیده بطن چپ. بنابراین، قطبش مجدد باعث بازگشت جریان آسیب در هر لید میشود، همانطور که در سمت راست در شکل 12-17 ذکر شده است.
THE J POINT IS THE ZERO REFERENCE POTENTIAL FOR ANALYZING CURRENT OF INJURY
One might think that the ECG machines could determine when no current is flowing around the heart. However, many stray currents exist in the body, such as currents resulting from skin potentials and from differences in ionic concentrations in different fluids of the body. There- fore, when two electrodes are connected between the arms or between an arm and a leg, these stray currents make it impossible to predetermine the exact zero refer- ence level in the ECG.
نقطه J پتانسیل صفر مرجع برای تجزیه و تحلیل جریان آسیب است
ممکن است تصور شود که دستگاههای نوار قلب میتوانند تشخیص دهند که هیچ جریانی در اطراف قلب جریان ندارد. با این حال، بسیاری از جریانهای سرگردان در بدن وجود دارد، مانند جریانهای ناشی از پتانسیلهای پوستی و تفاوت در غلظتهای یونی در مایعات مختلف بدن. بنابراین، هنگامیکه دو الکترود بین بازوها یا بین یک بازو و یک پا متصل میشوند، این جریانهای سرگردان، تعیین از پیش سطح مرجع صفر دقیق در ECG را غیرممکن میسازد.
For these reasons, the following procedure must be used to determine the zero potential level: First, one notes the exact point at which the wave of depolarization just completes its passage through the heart, which occurs at the end of the QRS complex. At exactly this point, all parts of the ventricles have become depolarized, including both the damaged parts and the normal parts, so no current is flowing around the heart. Even the current of injury disappears at this point. Therefore, the potential of the electrocardiogram at this instant is at zero voltage. This point is known as the J point in the ECG, as shown in Figure 12-18.
به این دلایل، روش زیر باید برای تعیین سطح پتانسیل صفر استفاده شود: ابتدا، نقطه دقیقی را که در آن موج دپلاریزاسیون از قلب عبور میکند، که در انتهای کمپلکس QRS رخ میدهد، یادداشت میکنیم. دقیقاً در این نقطه، تمام قسمتهای بطنها، از جمله بخشهای آسیبدیده و طبیعی، دپلاریزه شدهاند، بنابراین جریانی در اطراف قلب جریان ندارد. حتی جریان آسیب نیز در این مرحله ناپدید میشود. بنابراین، پتانسیل الکتروکاردیوگرام در این لحظه در ولتاژ صفر است. این نقطه همانطور که در شکل 12-18 نشان داده شده است به عنوان نقطه J در ECG شناخته میشود.
Then, for analysis of the electrical axis of the injury potential caused by a current of injury, a horizontal line is drawn in the ECG for each lead at the level of the J point. This horizontal line is then the zero potential level in the ECG from which all potentials caused by currents of injury must be measured.
سپس، برای تجزیه و تحلیل محور الکتریکی پتانسیل آسیب ناشی از جریان آسیب، یک خط افقی در ECG برای هر لید در سطح نقطه J رسم میشود. سپس این خط افقی سطح پتانسیل صفر در ECG است که تمام پتانسیلهای ناشی از جریان آسیب باید از آن اندازه گیری شود.
Use of the J Point in Plotting Axis of Injury Potential. Figure 12-18 shows ECGs (leads I and III) from an injured heart. Both records show injury potentials. In other words, the J point of each of these two ECGs is not on the same line as the T-P segment. In the figure, a horizontal line has been drawn through the J point to represent the zero voltage level in each of the two recordings. The injury potential in each lead is the difference between the voltage of the ECG immediately before onset of the P wave and the zero voltage level determined from the J point. In lead I, the recorded voltage of the injury potential is above the zero potential level and is therefore positive. Conversely, in lead III, the injury potential is below the zero voltage level and therefore is negative.
استفاده از نقطه J در ترسیم محور پتانسیل آسیب. شکل 12-18 نوار قلب (سرنخهای I و III) از یک قلب آسیب دیده را نشان میدهد. هر دو رکورد پتانسیل آسیب را نشان میدهند. به عبارت دیگر نقطه J هر یک از این دو ECG در یک خط با قطعه T-P قرار ندارد. در شکل، یک خط افقی از نقطه J رسم شده است تا سطح ولتاژ صفر را در هر یک از دو ضبط نشان دهد. پتانسیل آسیب در هر لید تفاوت بین ولتاژ ECG بلافاصله قبل از شروع موج P و سطح ولتاژ صفر تعیین شده از نقطه J است. در لید I، ولتاژ ثبت شده پتانسیل آسیب بالاتر از سطح پتانسیل صفر است و بنابراین مثبت است. برعکس، در لید III، پتانسیل آسیب کمتر از سطح ولتاژ صفر است و بنابراین منفی است.
At the bottom in Figure 12-18, the respective injury potentials in leads I and III are plotted on the coordinates of these leads, and the resultant vector of the injury potential for the whole ventricular muscle mass is determined by vectorial analysis as described. In this case, the resultant vector extends from the right side of the ventricles toward the left and slightly upward, with an axis of about -30 degrees. If one places this vector for the injury potential directly over the ventricles, the negative end of the vector points toward the permanently depolarized, “injured” area of the ventricles. In the example shown in Figure 12-18, the injured area would be in the lateral wall of the right ventricle.
در پایین در شکل 12-18، پتانسیل آسیب مربوطه در لیدهای I و III بر روی مختصات این لیدها ترسیم شده است، و بردار حاصل از پتانسیل آسیب برای کل توده عضلانی بطنی با تجزیه و تحلیل برداری که شرح داده شد، تعیین میشود. در این حالت، بردار حاصل از سمت راست بطنها به سمت چپ و کمیبه سمت بالا، با محوری در حدود 30- درجه گسترش مییابد. اگر کسی این ناقل را برای پتانسیل آسیب مستقیماً روی بطنها قرار دهد، انتهای منفی بردار به سمت ناحیه دائماً دپلاریزه و “آسیب دیده” بطنها اشاره میکند. در مثال نشان داده شده در شکل 12-18، ناحیه آسیب دیده در دیواره جانبی بطن راست خواهد بود.
This analysis is obviously complex. However, it is essential that the student review it again and again until it is thoroughly understood. No other aspect of electrocar- diographic analysis is more important.
این تحلیل آشکارا پیچیده است. با این حال، ضروری است که دانش آموز آن را بارها و بارها مرور کند تا زمانی که به طور کامل درک شود. هیچ جنبه دیگری از آنالیز الکتروکاردیوگرافی مهمتر نیست.
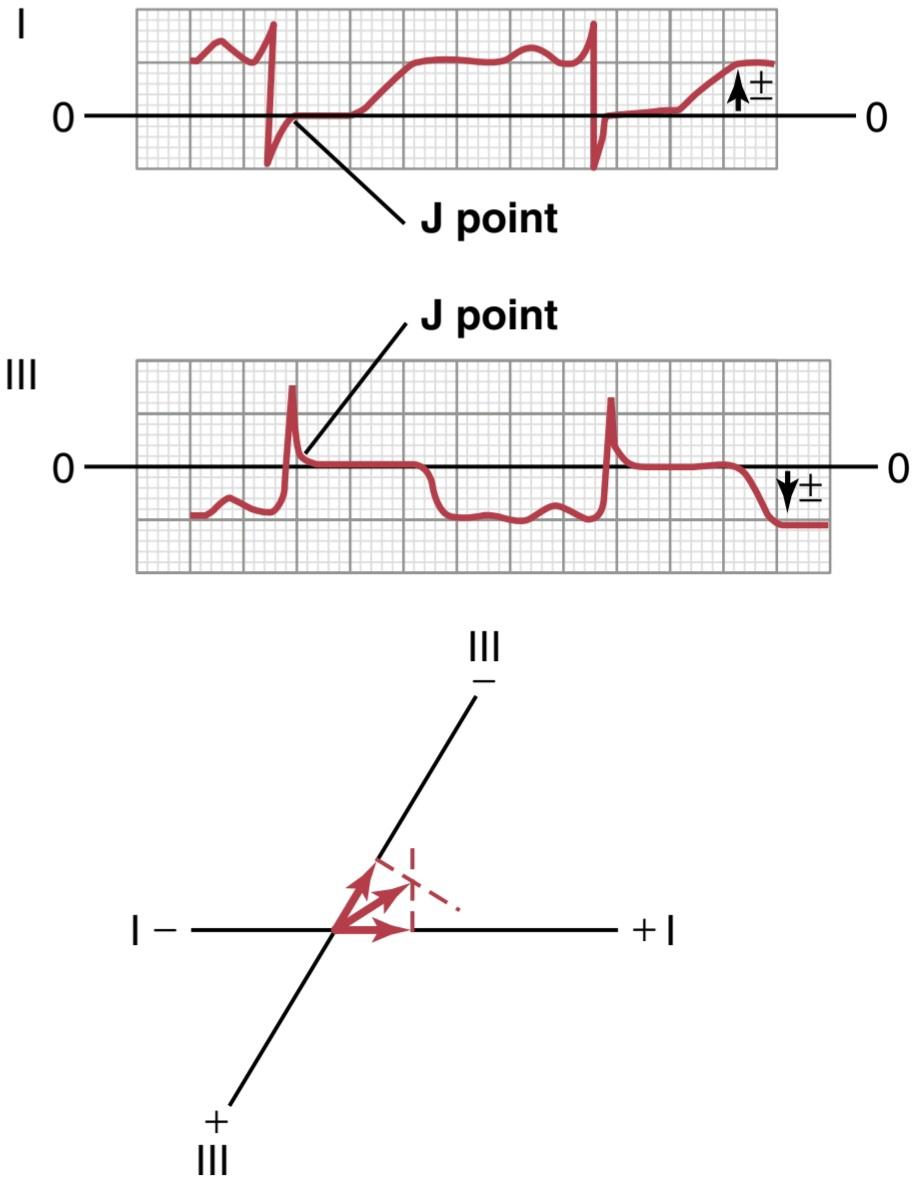
Figure 12-18 J point as the zero reference potential of the electrocardiograms for leads I and III. Also, the method for plotting the axis of the injury potential is shown in the bottom panel.
شکل 12-18 نقطه J به عنوان پتانسیل صفر مرجع الکتروکاردیوگرام برای لیدهای I و III. همچنین روش ترسیم محور پتانسیل آسیب در پانل پایین نشان داده شده است.
CORONARY ISCHEMIA AS A CAUSE OF INJURY POTENTIAL
Insufficient blood flow to the cardiac muscle depresses the metabolism of the muscle for at least three reasons: (1) lack of oxygen; (2) excess accumulation of carbon dioxide; and (3) lack of sufficient food nutrients. Consequently, repolarization of the muscle membrane cannot occur in areas of severe myocardial ischemia. Often, the heart muscle does not die because the blood flow is sufficient to maintain life of the muscle, even though it is not sufficient to cause normal repolarization of the membranes. As long as this state exists, an injury potential continues to flow during the diastolic portion (the T-P portion) of each heart cycle.
ایسکمیعروق کرونر به عنوان یک علت بالقوه آسیب
جریان خون ناکافی به عضله قلب متابولیسم عضله را حداقل به سه دلیل کاهش میدهد: (1) کمبود اکسیژن. (2) تجمع بیش از حد دی اکسید کربن. و (3) کمبود مواد مغذی غذایی کافی. در نتیجه، رپولاریزاسیون غشای عضلانی نمیتواند در مناطق ایسکمیشدید میوکارد رخ دهد. اغلب، عضله قلب نمیمیرد، زیرا جریان خون برای حفظ حیات عضله کافی است، حتی اگر برای ایجاد رپولاریزاسیون طبیعی غشاها کافی نباشد. تا زمانی که این حالت وجود دارد، یک پتانسیل آسیب در طول بخش دیاستولی (قسمت T-P) هر چرخه قلب به جریان خود ادامه میدهد.
Extreme ischemia of the cardiac muscle occurs after coronary occlusion, and a strong current of injury flows from the infarcted area of the ventricles during the T-P interval between heartbeats, as shown in Figs. 12-19 and 12-20. Therefore, one of the most important diagnostic features of ECGs recorded after acute coronary thrombosis is the current of injury.
ایسکمیشدید عضله قلب پس از انسداد عروق کرونر رخ میدهد و جریان شدیدی از آسیب از ناحیه انفارکتوس شده بطنها در طول فاصله T-P بین ضربان قلب جریان مییابد، همانطور که در شکل نشان داده شده است. 12-19 و 12-20. بنابراین، یکی از مهمترین ویژگیهای تشخیصی ECGهای ثبت شده پس از ترومبوز حاد کرونری، جریان آسیب است.
Acute Anterior Wall Infarction. Figure 12-19 shows the ECG in the three standard bipolar limb leads and in one chest lead (lead V2) recorded from a patient with acute anterior wall cardiac infarction. The most important diagnostic feature of this ECG is the intense injury potential in chest lead V2. If one draws a zero horizontal potential line through the J point of this ECG, a strong negative injury potential during the T-P interval is found, which means that the chest electrode over the front of the heart is in an area of strongly negative potential. In other words, the negative end of the injury potential vector in this heart is against the anterior chest wall. This means that the current of injury is emanating from the anterior wall of the ventricles, which diagnoses this condition as an anterior wall infarction.
انفارکتوس حاد دیواره قدامی. شکل 12-19 ECG را در سه لید استاندارد اندام دوقطبی و در یک لید قفسه سینه (Lead V2) نشان میدهد که از بیمار مبتلا به انفارکتوس حاد دیواره قدامیقلب ثبت شده است. مهمترین ویژگی تشخیصی این ECG پتانسیل آسیب شدید در لید قفسه سینه V2 است. اگر یک خط پتانسیل افقی صفر را از طریق نقطه J این ECG بکشیم، یک آسیب بالقوه منفی قوی در بازه T-P پیدا میشود، به این معنی که الکترود قفسه سینه در جلوی قلب در ناحیه ای با پتانسیل شدید منفی قرار دارد. به عبارت دیگر، انتهای منفی ناقل بالقوه آسیب در این قلب در مقابل دیواره قفسه سینه قرار دارد. این بدان معنی است که جریان آسیب از دیواره قدامیبطنها خارج میشود که این وضعیت را به عنوان انفارکتوس دیواره قدامیتشخیص میدهد.
When analyzing the injury potentials in leads I and III, one finds a negative potential in lead I and a positive potential in lead III. This finding means that the resultant vector of the injury potential in the heart is about +150 degrees, with the negative end pointing toward the left ventricle and the positive end pointing toward the right ventricle. Thus, in this ECG, the current of injury is coming mainly from the left ventricle, as well as from the anterior wall of the heart. Therefore, one would conclude that this anterior wall infarction almost certainly is caused by thrombosis of the anterior descending branch of the left coronary artery.
هنگام تجزیه و تحلیل پتانسیل آسیب در لیدهای I و III، یک پتانسیل منفی در لید I و یک پتانسیل مثبت در لید III پیدا میشود. این یافته به این معنی است که بردار حاصل از پتانسیل آسیب در قلب حدود 150+ درجه است که انتهای منفی آن به سمت بطن چپ و انتهای مثبت به سمت بطن راست است. بنابراین، در این ECG، جریان آسیب عمدتاً از بطن چپ و همچنین از دیواره قدامیقلب میآید. بنابراین، میتوان نتیجه گرفت که این انفارکتوس دیواره قدامیتقریباً به طور قطع ناشی از ترومبوز شاخه نزولی قدامیشریان کرونر چپ است.
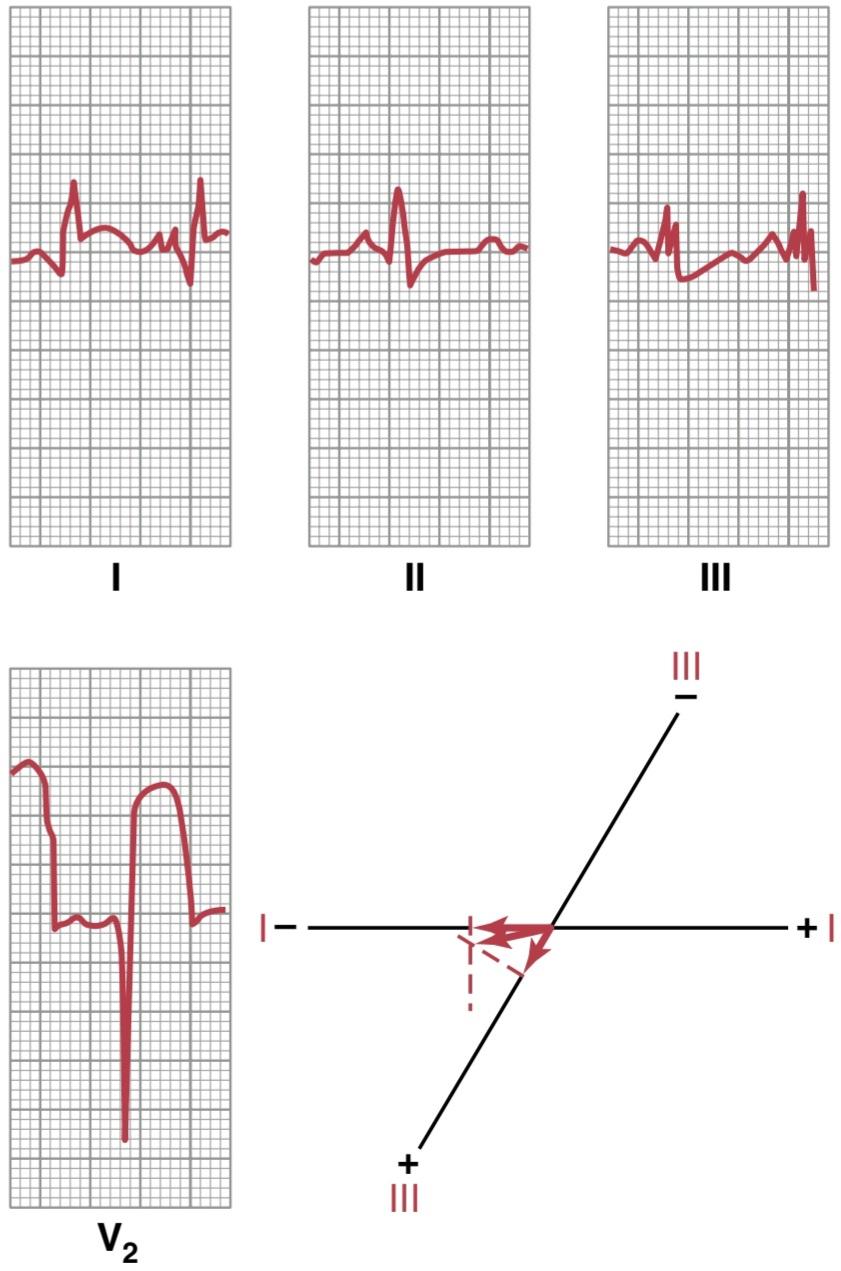
Figure 12-19 Current of injury in acute anterior wall infarction. Note the intense injury potential in lead V2-
شکل 12-19 جریان آسیب انفارکتوس حاد در دیواره قدامی. به پتانسیل آسیب شدید در لید V2 توجه کنید.
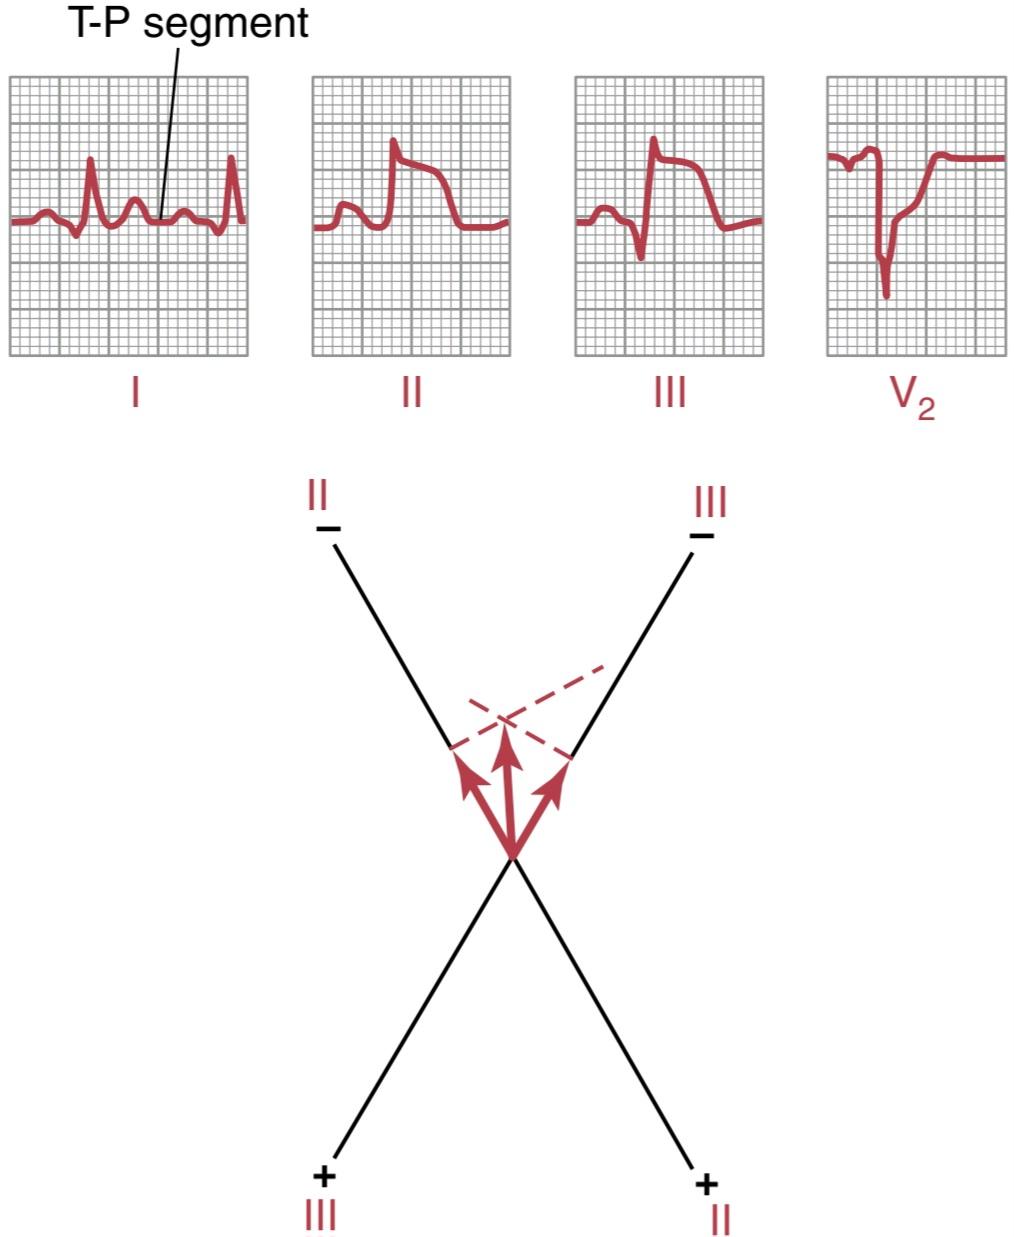
Figure 12-20 Injury potential in an acute posterior wall, apical infarction.
شکل 12-20 پتانسیل آسیب انفارکتوس حاد دیواره خلفی، در ناحیه آپیکال.
Posterior Wall Infarction. Figure 12-20 shows the three standard bipolar limb leads and one chest lead (lead V2) from a patient with a posterior wall infarction. The major diagnostic feature of this ECG is also in the chest lead. If a zero potential reference line is drawn through the J point of this lead, it is readily apparent that during the T-P interval, the potential of the current of injury is positive. This means that the positive end of the vector is in the direction of the anterior chest wall, and the negative end (the injured end of the vector) points away from the chest wall. In other words, the current of injury is coming from the back of the heart opposite to the anterior chest wall, which is the reason this type of ECG is the basis for diagnosing posterior wall infarction.
انفارکتوس دیواره خلفی. شکل 12-20 سه لید استاندارد اندام دوقطبی و یک لید قفسه سینه (لید V2) از یک بیمار مبتلا به انفارکتوس دیواره خلفی را نشان میدهد. ویژگی اصلی تشخیصی این ECG نیز در لید قفسه سینه است. اگر یک خط مرجع پتانسیل صفر از نقطه J این لید کشیده شود، به آسانی آشکار میشود که در طول بازه T-P، پتانسیل جریان آسیب مثبت است. این بدان معنی است که انتهای مثبت بردار در جهت دیواره قدامیقفسه سینه است و انتهای منفی (انتهای آسیب دیده بردار) از دیواره قفسه سینه فاصله دارد. به عبارت دیگر، جریان آسیب از پشت قلب در مقابل دیواره قدامیقفسه سینه میآید، به همین دلیل است که این نوع ECG مبنای تشخیص انفارکتوس دیواره خلفی است.
If one analyzes the injury potentials from leads II and III of Figure 12-20, it is readily apparent that the injury potential is negative in both leads. By vectorial analysis, as shown in the figure, one finds that the resultant vector of the injury potential is about -95 degrees, with the negative end pointing downward and the positive end pointing upward. Thus, because the infarct, as indicated by the chest lead, is on the posterior wall of the heart and, as indicated by the injury potentials in leads II and III, it is in the apical portion of the heart, one would suspect that this infarct is near the apex on the posterior wall of the left ventricle.
اگر کسی پتانسیل آسیب را از لیدهای II و III شکل 12-20 تجزیه و تحلیل کند، به آسانی آشکار میشود که پتانسیل آسیب در هر دو لید منفی است. با تجزیه و تحلیل برداری، همانطور که در شکل نشان داده شده است، میتوان دریافت که بردار حاصل از پتانسیل آسیب حدود 95- درجه است که انتهای منفی به سمت پایین و انتهای مثبت به سمت بالا است. بنابراین، از آنجا که انفارکتوس، همانطور که با لید قفسه سینه نشان میدهد، روی دیواره خلفی قلب است و همانطور که با پتانسیل آسیب در لیدهای II و III نشان میدهد، در قسمت آپیکال قلب است، میتوان گمان برد که این انفارکتوس نزدیک به راس دیواره خلفی بطن چپ است.
Infarction in Other Parts of the Heart. Using the same procedures demonstrated in the preceding discussions of anterior and posterior wall infarctions, it is often possible to determine the locus of an infarcted area emitting a current of injury. In making such vectorial analyses, it should be remembered that the positive end of the injury potential vector points toward the normal cardiac muscle, and the negative end points toward the injured portion of the heart that is emitting the current of injury.
انفارکتوس در سایر قسمتهای قلب. با استفاده از روشهای مشابهی که در بحثهای قبلی در مورد انفارکتوس دیواره قدامیو خلفی نشان داده شد، اغلب میتوان محل یک ناحیه انفارکتوس را که جریان آسیب منتشر میکند، تعیین کرد. در انجام چنین تحلیلهای برداری، باید به خاطر داشت که انتهای مثبت بردار پتانسیل آسیب به سمت عضله قلبی طبیعی و انتهای منفی به سمت قسمت آسیب دیده قلب است که جریان آسیب را ساطع میکند.
ECG Progression During and After Acute Coronary Thrombosis. Figure 12-21 shows a V3 chest lead from a patient with an acute anterior wall infarction, demonstrating changes in the ECG from the day of the attack to 1 week later, 3 weeks later and, finally. 1 year later. From this ECG, one can see that the injury potential is strong immediately after the acute attack (the T-P segment is displaced positively from the S-T segment). However, after about 1 week, the injury potential has diminished considerably and, after 3 weeks, it is gone. After that, the ECG does not change greatly during the next year. This is the usual recovery pattern after an acute myocardial infarction of moderate degree, showing that the new collateral coronary blood flow develops enough to re-establish appropriate nutrition to most of the infarcted area.
پیشرفت ECG در طول و بعد از ترومبوز حاد کرونر. شکل 12-21 لید قفسه سینه V3 را از یک بیمار با انفارکتوس حاد دیواره قدامینشان میدهد که تغییرات ECG را از روز حمله تا 1 هفته بعد، 3 هفته بعد و در نهایت نشان میدهد. 1 سال بعد از این ECG، میتوان دریافت که پتانسیل آسیب بلافاصله پس از حمله حاد قوی است (بخش T-P به طور مثبت از بخش S-T جابجا میشود). با این حال، پس از حدود 1 هفته، پتانسیل آسیب به طور قابل توجهی کاهش یافته و پس از 3 هفته، از بین میرود. پس از آن، ECG در طول سال آینده تغییر زیادی نمیکند. این الگوی معمول بهبودی پس از یک انفارکتوس حاد میوکارد با درجه متوسط است، که نشان میدهد جریان خون کرونر جانبی جدید به اندازهای توسعه مییابد که تغذیه مناسب را در بیشتر ناحیه انفارکتوس دوباره برقرار کند.
In some patients who experience myocardial infarction, the infarcted area never redevelops adequate coronary blood supply. Often, some of the heart muscle dies but, if the muscle does not die, it will continue to show an injury potential as long as the ischemia exists, particularly during bouts of exercise when the heart is overloaded.
در برخی از بیمارانی که انفارکتوس میوکارد را تجربه میکنند، ناحیه انفارکتوس شده هرگز منبع خون کافی در کرونری را ایجاد نمیکند. اغلب، برخی از عضله قلب میمیرد، اما اگر عضله از بین نرود، تا زمانی که ایسکمیوجود داشته باشد، احتمال آسیب را نشان میدهد، بهویژه در طول دورههای تمرینی که قلب بیش از حد بارگذاری میشود.
Q Waves on an ECG Represent Old Myocardial Infarction. Figure 12-22 shows leads I and III after anterior and posterior infarctions about 1 year after the acute heart attacks. Usually, a Q wave has developed at the beginning of the QRS complex in lead I in anterior infarction be- cause of the loss of muscle mass in the anterior wall of the left ventricle but, in a posterior infarction, a Q wave has developed at the beginning of the QRS complex in lead III because of loss of muscle in the posterior apical part of the ventricle.
امواج Q در ECG نشان دهنده انفارکتوس میوکارد قدیمیاست. شکل 12-22 لیدهای I و III را پس از انفارکتوس قدامیو خلفی حدود 1 سال پس از حملات حاد قلبی نشان میدهد. معمولاً یک موج Q در ابتدای کمپلکس QRS در لید I در انفارکتوس قدامیبه دلیل از دست دادن توده عضلانی در دیواره قدامیبطن چپ ایجاد میشود، اما در انفارکتوس خلفی، به دلیل از دست دادن عضله در قسمت آپیکال خلفی بطن، موج Q در ابتدای کمپلکس QRS در لید III ایجاد میشود.
These configurations are certainly not found in all cases of old myocardial infarction. Local loss of muscle and local points of cardiac signal conduction block can cause very bizarre QRS patterns (e.g., especially prominent Q waves), decreased voltage, and QRS prolongation.
این تنظیمات مطمئناً در همه موارد سکته قلبی قدیمییافت نمیشوند. از دست دادن موضعی عضله و نقاط موضعی بلوک هدایت سیگنال قلبی میتواند باعث الگوهای QRS بسیار عجیب و غریب (به عنوان مثال، امواج Q برجسته)، کاهش ولتاژ و طولانی شدن QRS شود.
Current of Injury in Angina Pectoris. The term angina pectoris means pain from the heart felt in the pectoral regions of the chest. This pain usually also radiates into the left neck area and down the left arm. The pain is typically caused by moderate ischemia of the heart. Usually, no pain is felt as long as the person is quiet, but as soon as the heart is overworked, the pain appears.
جریان آسیب در آنژین صدری. اصطلاح آنژین صدری به معنای درد ناشی از قلب در نواحی سینه ای قفسه سینه است. این درد معمولاً به ناحیه گردن چپ و پایین بازوی چپ نیز تابش میکند. درد به طور معمول ناشی از ایسکمیمتوسط قلب است. معمولاً تا زمانی که فرد ساکت است هیچ دردی احساس نمیشود، اما به محض اینکه قلب بیش از حد کار کند، درد ظاهر میشود.
An injury potential sometimes appears on the ECG during an attack of severe angina pectoris because the coronary insufficiency becomes great enough to prevent adequate repolarization of some areas of the heart during diastole.
گاهی اوقات در هنگام حمله آنژین صدری شدید، یک پتانسیل آسیب در ECG ظاهر میشود، زیرا نارسایی عروق کرونر به اندازه کافی بزرگ میشود تا از رپولاریزاسیون کافی در برخی از نواحی قلب در طول دیاستول جلوگیری کند.
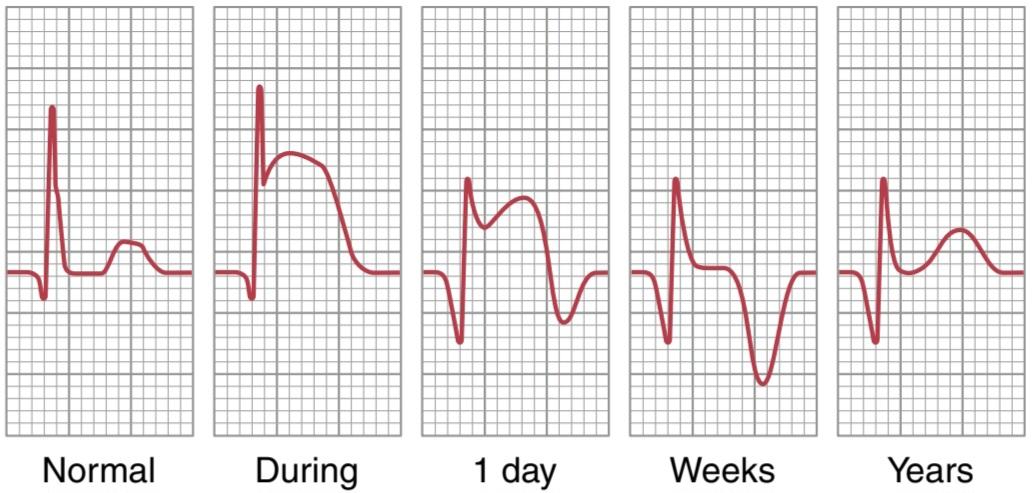
Figure 12-21 Recovery of the myocardium after anterior wall infarction, demonstrating the disappearance of the injury potential that is present on the first day after the infarction.
شکل 12-21 بازیابی میوکارد پس از انفارکتوس دیواره قدامی، نشان دهنده ناپدید شدن پتانسیل آسیبی است که در روز اول پس از انفارکتوس وجود دارد.

Figure 12-22 Electrocardiograms of anterior and posterior wall infarctions that occurred about 1 year previously, showing a Q wave in lead I in an anterior wall infarction and a Q wave in lead III in a posterior wall infarction.
شکل 12-22 الکتروکاردیوگرام انفارکتوسهای دیواره قدامیو خلفی که حدود 1 سال قبل رخ داده است، موج Q را در لید I در انفارکتوس دیواره قدامیو موج Q را در لید III در انفارکتوس دیواره خلفی نشان میدهد.
ABNORMALITIES IN THE T WAVE
Earlier in the chapter, we noted that the T wave is normally positive in all the standard bipolar limb leads, and that this is caused by repolarization of the apex and outer surfaces of the ventricles ahead of the intraventricular surfaces. That is, the T wave becomes abnormal when the normal sequence of repolarization does not occur. Several factors, including myocardial ischemia, can change this sequence of repolarization.
ناهنجاری در موج T
در اوایل این فصل، ما اشاره کردیم که موج T در تمام لیدهای استاندارد دوقطبی اندام به طور معمول مثبت است و این امر به دلیل رپلاریزاسیون راس و سطوح بیرونی بطنها جلوتر از سطوح داخل بطنی ایجاد میشود. یعنی زمانی که توالی طبیعی رپلاریزاسیون اتفاق نیفتد موج T غیر طبیعی میشود. عوامل متعددی، از جمله ایسکمیمیوکارد، میتوانند این توالی رپلاریزاسیون را تغییر دهند.
EFFECT OF SLOW CONDUCTION OF THE DEPOLARIZATION WAVE ON THE CHARACTERISTICS OF THE T WAVE
Referring to Figure 12-14, note that the QRS complex is considerably prolonged. The reason for this prolongation is delayed conduction in the left ventricle resulting from left bundle branch block. This delayed conduction causes the left ventricle to become depolarized about 0.08 second after depolarization of the right ventricle, which gives a strong mean QRS vector to the left. However, the refractory periods of the right and left ventricular muscle masses are not greatly different from each other. Therefore, the right ventricle begins to repolarize long before the left ventricle, which causes strong positivity in the right ventricle and negativity in the left ventricle when the T wave is developing. In other words, the mean axis of the T wave is now deviated to the right, which is opposite to the mean electrical axis of the QRS complex in the same ECG. Thus, when conduction of the depolarization impulse through the ventricles is greatly delayed, the T wave is almost always of opposite polarity to that of the QRS complex.
تأثیر هدایت آهسته موج دپولاریزاسیون بر ویژگیهای موج T
با مراجعه به شکل 12-14، توجه داشته باشید که کمپلکس QRS به طور قابل توجهی طولانی شده است. دلیل این طولانی شدن تاخیر در هدایت در بطن چپ ناشی از بلوک شاخه چپ است. این هدایت تاخیری باعث میشود که بطن چپ حدود 0.08 ثانیه پس از دپلاریزاسیون بطن راست دپلاریزه شود، که یک وکتور QRS متوسط قوی به سمت چپ میدهد. با این حال، دورههای نسوز توده عضلانی بطن راست و چپ تفاوت زیادی با یکدیگر ندارند. بنابراین، بطن راست مدتها قبل از بطن چپ شروع به رپلاریزه شدن میکند، که باعث مثبت شدن قوی در بطن راست و منفی شدن در بطن چپ در هنگام ایجاد موج T میشود. به عبارت دیگر، محور میانگین موج T اکنون به سمت راست منحرف شده است که در مقابل محور الکتریکی میانگین مجتمع QRS در همان ECG است. بنابراین، هنگامیکه رسانش تکانه دپلاریزاسیون از طریق بطنها به شدت به تأخیر میافتد، موج T تقریباً همیشه قطب مخالف مجموعه QRS است.
SHORTENED DEPOLARIZATION IN PORTIONS OF THE VENTRICULAR MUSCLE CAN CAUSE T-WAVE ABNORMALITIES
If the base of the ventricles should exhibit an abnormally short period of depolarization-that is, a shortened action potential-repolarization of the ventricles would not begin at the apex, as it normally does. Instead, the base of the ventricles would repolarize ahead of the apex, and the vector of repolarization would point from the apex toward the base of the heart, opposite to the standard vector of repolarization. Consequently, the T wave in all three standard leads would be negative rather than the usual positive. Thus, the simple fact that the base of the ventricles has a shortened period of depolarization is sufficient to cause marked changes in the T wave, even to the extent of changing the entire T-wave polarity, as shown in Figure 12-23.
دپولاریزاسیون کوتاه شده در بخشهایی از عضله بطنی میتواند باعث ناهنجاریهای موج T شود.
اگر قاعده بطنها باید یک دوره غیرطبیعی دپلاریزاسیون کوتاه را نشان دهد – یعنی یک پتانسیل عمل کوتاهتر – رپلاریزاسیون بطنها مانند معمول از راس شروع نمیشود. در عوض، قاعده بطنها جلوتر از راس مجدداً قطبی میشود و بردار رپلاریزاسیون از راس به سمت قاعده قلب، برخلاف بردار استاندارد رپلاریزاسیون، اشاره میکند. در نتیجه، موج T در هر سه لید استاندارد به جای مثبت معمول منفی خواهد بود. بنابراین، این واقعیت ساده که قاعده بطنها دوره کوتاهتری از دپلاریزاسیون دارد، برای ایجاد تغییرات مشخص در موج T، حتی تا حد تغییر کل قطبیت موج T، کافی است، همانطور که در شکل 12-23 نشان داده شده است.
Mild ischemia is the most common cause of shortening of depolarization of cardiac muscle because this condition increases current flow through the potassium channels. When the ischemia occurs in only one area of the heart, the depolarization period of this area decreases out of proportion to that in other portions. As a result, changes in the T-wave morphology, such as inversion or biphasic waveforms, can be evidence of myocardial ischemia. The ischemia might result from chronic, progressive coronary stenosis (narrowing), acute coronary occlusion, coronary artery spasm, or relative coronary insufficiency that occurs during exercise or severe anemia.
ایسکمیخفیف شایع ترین علت کوتاه شدن دپلاریزاسیون عضله قلب است زیرا این وضعیت باعث افزایش جریان جریان از طریق کانالهای پتاسیم میشود. هنگامیکه ایسکمیفقط در یک ناحیه از قلب رخ میدهد، دوره دپلاریزاسیون این ناحیه نسبت به سایر قسمتها کاهش مییابد. در نتیجه، تغییرات در مورفولوژی موج T، مانند شکل موج وارونگی یا دو فازی، میتواند شواهدی از ایسکمیمیوکارد باشد. ایسکمیممکن است ناشی از تنگی مزمن و پیشرونده کرونر (تنگی)، انسداد حاد کرونر، اسپاسم عروق کرونر، یا نارسایی نسبی کرونر باشد که در حین ورزش یا کم خونی شدید رخ میدهد.

Figure 12-23 An inverted T wave resulting from mild ischemia at the base of the ventricles.
شکل 12-23 یک موج T معکوس ناشی از ایسکمیخفیف در پایه بطنها.
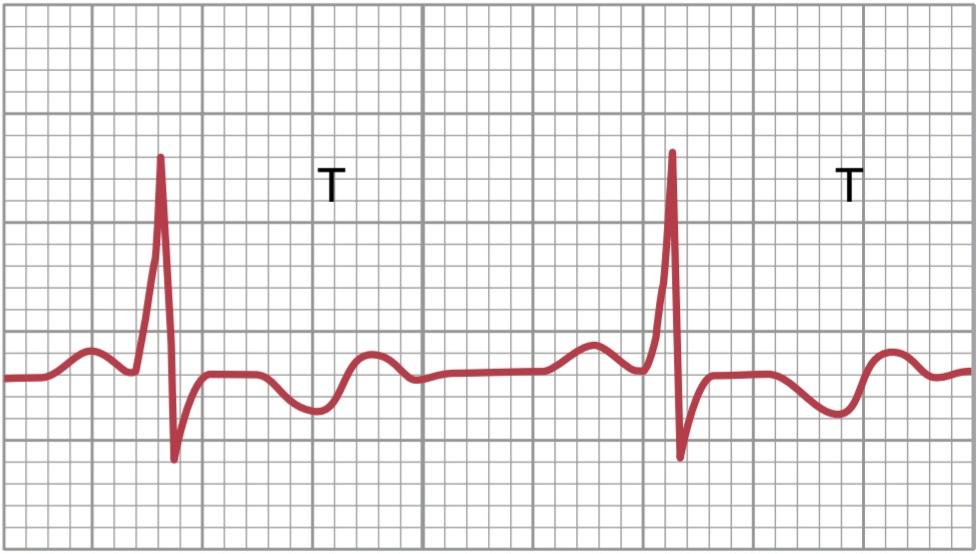
Figure 12-24 A biphasic T wave caused by digitalis toxicity.
شکل 12-24 یک موج T دوفازی ناشی از سمیت دیجیتالیس.
Effect of Digitalis on the T Wave. As discussed in Chapter 22, digitalis is a drug that can be used during heart failure to increase the strength of cardiac muscle contraction. However, when an overdose of digitalis is given, depolarization duration in one part of the ventricles may be increased out of proportion to that of other parts. As a result, nonspecific changes, such as T-wave inversion or biphasic T waves, may occur in one or more of the electrocardiographic leads. A biphasic T wave caused by excessive administration of digitalis is shown in Figure 12-24. Therefore, changes in the T wave during digitalis administration are often the earliest signs of digitalis toxicity.
اثر Digitalis بر موج T. همانطور که در فصل 22 بحث شد، دیژیتال دارویی است که میتواند در هنگام نارسایی قلبی برای افزایش قدرت انقباض عضله قلب استفاده شود. با این حال، هنگامیکه دوز بیش از حد از دیژیتال داده میشود، مدت دپلاریزاسیون در یک قسمت از بطنها ممکن است به تناسب سایر قسمتها افزایش یابد. در نتیجه، تغییرات غیر اختصاصی، مانند نسخه موج T یا امواج T دو فازی، ممکن است در یک یا چند لید الکتروکاردیوگرافی رخ دهد. یک موج T دوفازی ناشی از تجویز بیش از حد دیژیتال در شکل 12-24 نشان داده شده است. بنابراین، تغییرات در موج T در طول تجویز دیژیتال، اغلب اولین نشانههای سمیت دیژیتال است.
کلیک کنید «Bibliography: فهرست کتب مربوطه»
see the bibliorgphy for chapter 13
🚀 با ما همراه شوید!
تازهترین مطالب و آموزشهای مغز و اعصاب را از دست ندهید. با فالو کردن کانال تلگرام آیندهنگاران مغز، از ما حمایت کنید!