
فیزیولوژی پزشکی گایتون و هال؛ برون ده قلبی، بازگشت وریدی و تنظیم آنها


دعای مطالعه [ نمایش ]
بِسْمِ الله الرَّحْمنِ الرَّحیمِ
اَللّهُمَّ اَخْرِجْنى مِنْ ظُلُماتِ الْوَهْمِ
خدايا مرا بيرون آور از تاريكىهاى وهم،
وَ اَكْرِمْنى بِنُورِ الْفَهْمِ
و به نور فهم گرامى ام بدار،
اَللّهُمَّ افْتَحْ عَلَيْنا اَبْوابَ رَحْمَتِكَ
خدايا درهاى رحمتت را به روى ما بگشا،
وَانْشُرْ عَلَيْنا خَزائِنَ عُلُومِكَ بِرَحْمَتِكَ يا اَرْحَمَ الرّاحِمينَ
و خزانههاى علومت را بر ما باز كن به امید رحمتت اى مهربانترين مهربانان.
کتاب «فیزیولوژی پزشکی گایتون و هال» بهعنوان یکی از جامعترین و معتبرترین منابع در حوزه علوم پزشکی، همچنان مرجع کلیدی برای درک عملکرد پیچیده بدن انسان است. این اثر با تکیه بر تازهترین پژوهشها و توضیحات دقیق از سازوکارهای فیزیولوژیک، پلی میان علوم پایه پزشکی و کاربردهای بالینی ایجاد میکند و نقشی بیبدیل در آموزش، پژوهش و ارتقای دانش سلامت ایفا مینماید.
ترجمه دقیق و علمی این شاهکار توسط برند علمی آیندهنگاران مغز به مدیریت داریوش طاهری، دسترسی فارسیزبانان به مرزهای نوین دانش فیزیولوژی را ممکن ساخته و رسالتی علمی برای ارتقای آموزش پزشکی، فهم عمیقتر سازوکارهای بدن و توسعه روشهای نوین در حوزه سلامت فراهم آورده است.
» کتاب فیزیولوژی پزشکی گایتون و هال
» » فصل ۲۰: برون ده قلبی، بازگشت وریدی و تنظیم آنها
در حال ویرایش
» Guyton and Hall Textbook of Medical Physiology
»» CHAPTER 20: Cardiac Output, Venous Return, and Their Regulation
 Cardiac output is the quantity of blood pumped into the aorta each minute by the heart. This is also the quantity of blood that flows through the circulation. Because cardiac output is the sum of the blood flow to all the tissues of the body, it is one of the most important factors to consider in relation to function of the cardiovascular system.
برون ده قلبی مقدار خونی است که در هر دقیقه توسط قلب به آئورت پمپ می شود. این نیز مقدار خونی است که از طریق گردش خون جریان می یابد. از آنجایی که برون ده قلبی مجموع جریان خون به تمام بافت های بدن است، یکی از مهم ترین عواملی است که در رابطه با عملکرد سیستم قلبی عروقی باید در نظر گرفته شود.
Venous return is equally important because it is the quantity of blood flowing from the veins into the right atrium each minute. The venous return and the cardiac output must equal each other except for a few heartbeats when blood is temporarily stored in or removed from the heart and lungs.
بازگشت وریدی به همان اندازه مهم است زیرا مقدار خونی است که در هر دقیقه از وریدها به دهلیز راست جریان می یابد. بازگشت وریدی و برون ده قلبی باید با یکدیگر برابر باشند، به جز چند ضربان قلب که خون به طور موقت در قلب و ریه ها ذخیره می شود یا از آن خارج می شود.
NORMAL VALUES FOR CARDIAC OUTPUT AT REST AND DURING ACTIVITY
Cardiac output varies widely with the level of activity of the body. The following factors, among others, directly affect cardiac output: (1) the basic level of body metabolism; (2) whether the person is exercising; (3) the person’s age; and (4) the size of the body.
مقادیر نرمال برای برون ده قلبی در حالت استراحت و در حین فعالیت
برون ده قلب به طور گسترده ای با سطح فعالیت بدن متفاوت است. عوامل زیر به طور مستقیم بر برون ده قلبی تأثیر می گذارند: (1) سطح پایه متابولیسم بدن. (2) آیا فرد در حال ورزش است یا خیر. (3) سن فرد؛ و (4) اندازه بدن.
For young healthy men, resting cardiac output averages about 5.6 L/min. For women, this value is about 4.9 L/min. When one considers the factor of age as well-because with increasing age, body activity and mass of some tissues (e.g., skeletal muscle) diminish-the average cardiac output for the resting adult, in round numbers, is often stated to be about 5 L/min. However, cardiac output varies considerably among healthy men and women depending on muscle mass, adiposity, physical activity, and other factors that influence metabolic rate and nutritional needs of the tissues.
برای مردان جوان سالم، برون ده قلبی در حالت استراحت به طور متوسط حدود 5.6 لیتر در دقیقه است. برای زنان، این مقدار حدود 4.9 لیتر در دقیقه است. وقتی عامل سن را خوب در نظر بگیریم، زیرا با افزایش سن، فعالیت بدن و توده برخی از بافت ها (مانند ماهیچه های اسکلتی) کاهش می یابد، متوسط برون ده قلبی برای بزرگسالان در حال استراحت، در اعداد گرد، اغلب حدود 5 لیتر در دقیقه بیان می شود. با این حال، برون ده قلبی به میزان قابل توجهی در بین مردان و زنان سالم بسته به توده عضلانی، چاقی، فعالیت بدنی و سایر عواملی که بر میزان متابولیک و نیازهای تغذیه ای بافت ها تأثیر می گذارد، متفاوت است.
Cardiac Index
Experiments have shown that the cardiac output increases approximately in proportion to the surface area of the body. Therefore, cardiac output is frequently stated in terms of the cardiac index, which is the cardiac output per square meter of body surface area. The average person who weighs 70 kilograms has a body surface area of about 1.7 square meters, which means that the normal average cardiac index for adults is about 3 L/min/m2 of body surface area.
شاخص قلبی
آزمایش ها نشان داده اند که برون ده قلبی تقریباً متناسب با سطح بدن افزایش می یابد. بنابراین، برون ده قلبی اغلب بر حسب شاخص قلبی بیان می شود که برون ده قلبی در هر متر مربع از سطح بدن است. سطح بدن فردی که به طور متوسط 70 کیلوگرم وزن دارد حدود 1.7 متر مربع است، به این معنی که میانگین شاخص قلبی طبیعی برای بزرگسالان حدود 3 لیتر در دقیقه در متر مربع از سطح بدن است.
Effect of Age on Cardiac Output. Figure 20-1 shows the cardiac output, expressed as cardiac index, at different ages. The cardiac index rises rapidly to a level greater than 4 L/min/m2 at age 10 years and declines to about 2.4 L/min/m2 at age 80 years. We explain later in this chapter that the cardiac output is regulated throughout life almost directly in proportion to overall metabolic activity. Therefore, the declining cardiac index is indicative of declining activity and/or declining muscle mass with age.
تأثیر سن بر برون ده قلبی. شکل 20-1 برون ده قلبی را که به صورت شاخص قلبی بیان می شود، در سنین مختلف نشان می دهد. شاخص قلبی در سن 10 سالگی به سرعت به سطحی بیش از 4 L/min/m2 افزایش می یابد و در سن 80 سالگی به حدود 2.4 L/min/m2 کاهش می یابد. بعداً در این فصل توضیح می دهیم که برون ده قلبی در طول زندگی تقریباً مستقیماً متناسب با فعالیت متابولیک کلی تنظیم می شود. بنابراین، کاهش شاخص قلبی نشان دهنده کاهش فعالیت و/یا کاهش توده عضلانی با افزایش سن است.
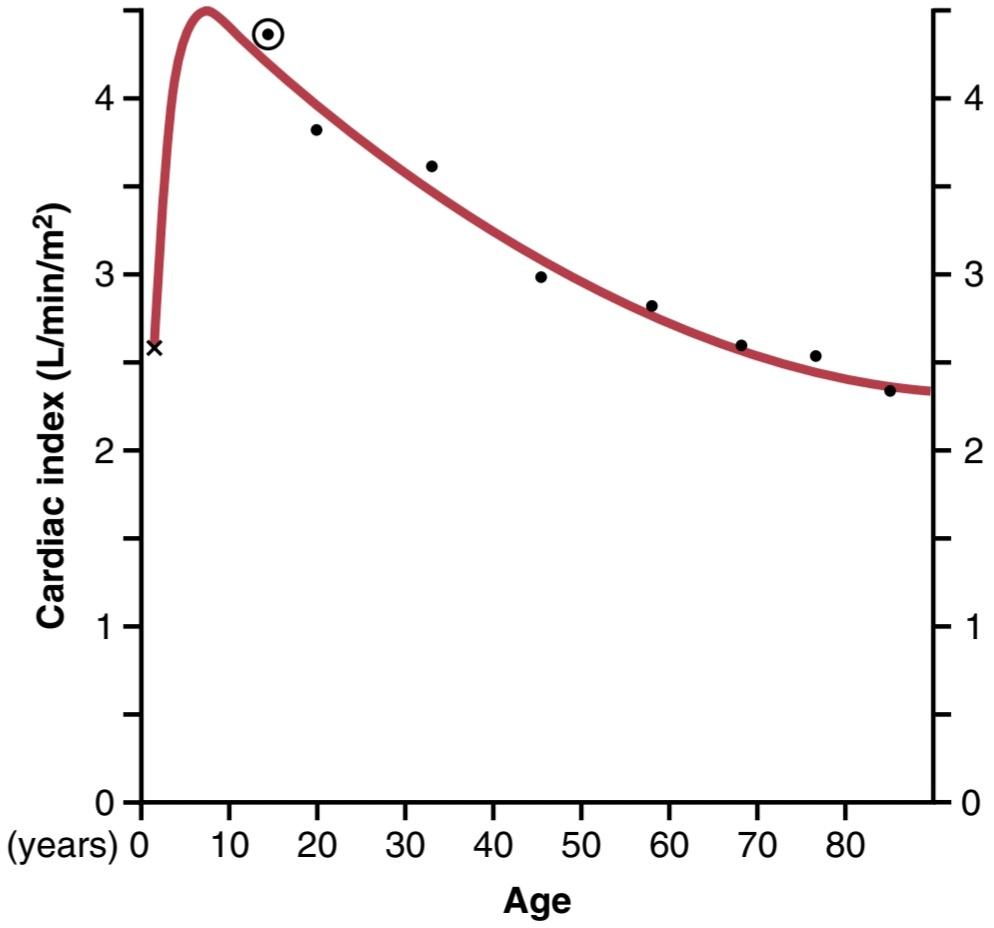
Figure 20-1. Cardiac index for a person-cardiac output per square meter of surface area-at different ages. (Modified from Guyton AC, Jones CE, Coleman TG: Circulatory Physiology: Cardiac Output and Its Regulation, 2nd ed. Philadelphia: WB Saunders, 1973.)
شکل 20-1. شاخص قلبی برای یک فرد-برون ده قلبی در هر متر مربع از سطح – در سنین مختلف. (اصلاح شده از Guyton AC, Jones CE, Coleman TG: Circulation Physiology: Cardiac Output and Itsregulation, ed. 2nd. Philadelphia: WB Saunders, 1973.)
CONTROL OF CARDIAC OUTPUT BY VENOUS RETURN-FRANK-STARLING MECHANISM OF THE HEART
Although heart function is obviously crucial in determining cardiac output, the various factors of the peripheral circulation that affect flow of blood into the heart from the veins, called venous return, are normally the primary controllers of cardiac output.
کنترل برون ده قلبی توسط مکانیسم بازگشت وریدی-فرانک-ستارلینگ قلب
اگرچه عملکرد قلب آشکارا در تعیین برون ده قلبی بسیار مهم است، عوامل مختلف گردش خون محیطی که بر جریان خون از وریدها به قلب تأثیر میگذارند، به نام بازگشت وریدی، معمولاً کنترلکنندههای اولیه برون ده قلبی هستند.
The main reason why peripheral factors are usually so important in controlling cardiac output is that the heart has a built-in mechanism that normally allows it to pump automatically the amount of blood that flows from the veins into the right atrium. This mechanism, called the Frank-Starling law of the heart, was discussed in Chapter 9. Basically, this law states that when increased quantities of blood flow into the heart, the increased volume of blood stretches the walls of the heart chambers. As a result of the stretch, the cardiac muscle contracts with increased force, and this action ejects the extra blood that has entered from the systemic circulation. Therefore, the blood that flows into the heart is automatically pumped without delay into the aorta and flows again through the circulation.
دلیل اصلی اینکه چرا عوامل محیطی معمولاً در کنترل برون ده قلبی بسیار مهم هستند این است که قلب مکانیسم داخلی دارد که به طور معمول به آن اجازه می دهد تا مقدار خونی را که از وریدها به دهلیز راست می ریزد به طور خودکار پمپ کند. این مکانیسم که قانون قلب فرانک- استارلینگ نامیده می شود، در فصل 9 مورد بحث قرار گرفت. اساساً، این قانون بیان می کند که وقتی مقادیر بیشتری از جریان خون در قلب جریان می یابد، افزایش حجم خون دیواره های اتاق های قلب را کشیده می شود. در نتیجه کشش، عضله قلب با افزایش نیرو منقبض می شود و این عمل خون اضافی وارد شده از گردش خون سیستمیک را خارج می کند. بنابراین، خونی که به قلب می ریزد، به طور خودکار و بدون تاخیر به داخل آئورت پمپ می شود و دوباره از طریق گردش خون جریان می یابد.
Another important factor, discussed in Chapters 10 and 18, is that stretching the heart causes an increased heart rate. Stretch of the sinus node in the wall of the right atrium has a direct effect on the rhythmicity of the node to increase the heart rate as much as 10% to 15%. In addition, the stretched right atrium initiates a nervous reflex called the Bainbridge reflex, passing first to the vasomotor center of the brain and then back to the heart by way of the sympathetic nerves and vagi, which also increases the heart rate.
عامل مهم دیگری که در فصل های 10 و 18 مورد بحث قرار گرفت این است که کشش قلب باعث افزایش ضربان قلب می شود. کشش گره سینوسی در دیواره دهلیز راست تأثیر مستقیمی بر ریتمیک گره دارد تا ضربان قلب را بین 10 تا 15 درصد افزایش دهد. علاوه بر این، دهلیز راست کشیده یک رفلکس عصبی به نام رفلکس باین بریج را آغاز می کند که ابتدا به مرکز وازوموتور مغز می رود و سپس از طریق اعصاب سمپاتیک و واگی به قلب بازمی گردد، که ضربان قلب را نیز افزایش می دهد.
Under most normal unstressed conditions, the cardiac output is controlled mainly by peripheral factors that determine venous return. However, as we discuss later in the chapter, if the returning blood does become more than the heart can pump, then the heart becomes the limiting factor that determines cardiac output.
در اکثر شرایط عادی بدون استرس، برون ده قلبی عمدتاً توسط عوامل محیطی که بازگشت وریدی را تعیین می کنند، کنترل می شود. با این حال، همانطور که بعداً در این فصل بحث خواهیم کرد، اگر خون برگشتی بیشتر از آن باشد که قلب می تواند پمپ کند، آنگاه قلب به عامل محدودکننده ای تبدیل می شود که برون ده قلبی را تعیین می کند.
Cardiac Output Is the Sum of All Tissue Blood Flows-Tissue Metabolism Regulates Most Local Blood Flow
The venous return to the heart is the sum of all the local blood flow through all the individual tissue segments of the peripheral circulation (Figure 20-2). Therefore, it follows that cardiac output regulation is normally the sum of all the local blood flow regulations.
برون ده قلبی مجموع تمام جریان های خون بافتی است – متابولیسم بافت اکثر جریان خون موضعی را تنظیم می کند
بازگشت وریدی به قلب مجموع تمام جریان خون موضعی از طریق تمام بخش های بافتی گردش خون محیطی است (شکل 20-2). بنابراین، به این ترتیب است که تنظیم برون ده قلبی معمولاً مجموع تمام مقررات محلی جریان خون است.
The mechanisms of local blood flow regulation were discussed in Chapter 17. In most tissues, blood flow increases mainly in proportion to each tissue’s metabolism. For example, local blood flow almost always increases when tissue oxygen consumption increases; this effect is demonstrated in Figure 20-3 for different levels of exercise. Note that at each increasing level of work output during exercise, oxygen consumption and cardiac output increase in parallel to each other.
مکانیسم های تنظیم جریان خون موضعی در فصل 17 مورد بحث قرار گرفت. در اکثر بافت ها، جریان خون عمدتاً متناسب با متابولیسم هر بافت افزایش می یابد. به عنوان مثال، جریان خون موضعی تقریباً همیشه با افزایش مصرف اکسیژن بافت افزایش می یابد. این اثر در شکل 20-3 برای سطوح مختلف تمرین نشان داده شده است. توجه داشته باشید که در هر سطح افزایشی برون ده کار در حین ورزش، مصرف اکسیژن و برون ده قلبی به موازات یکدیگر افزایش می یابد.
To summarize, cardiac output is usually determined by the sum of all the various factors throughout the body that control local blood flow. All the local blood flows summate to form the venous return, and the heart automatically pumps this returning blood back into the arteries to flow around the system again.
به طور خلاصه، برون ده قلبی معمولاً با مجموع همه عوامل مختلف در سراسر بدن تعیین می شود که جریان خون موضعی را کنترل می کنند. تمام جریان های خون موضعی جمع می شوند تا بازگشت وریدی را تشکیل دهند و قلب به طور خودکار این خون برگشتی را به داخل شریان ها پمپ می کند تا دوباره در اطراف سیستم جریان یابد.
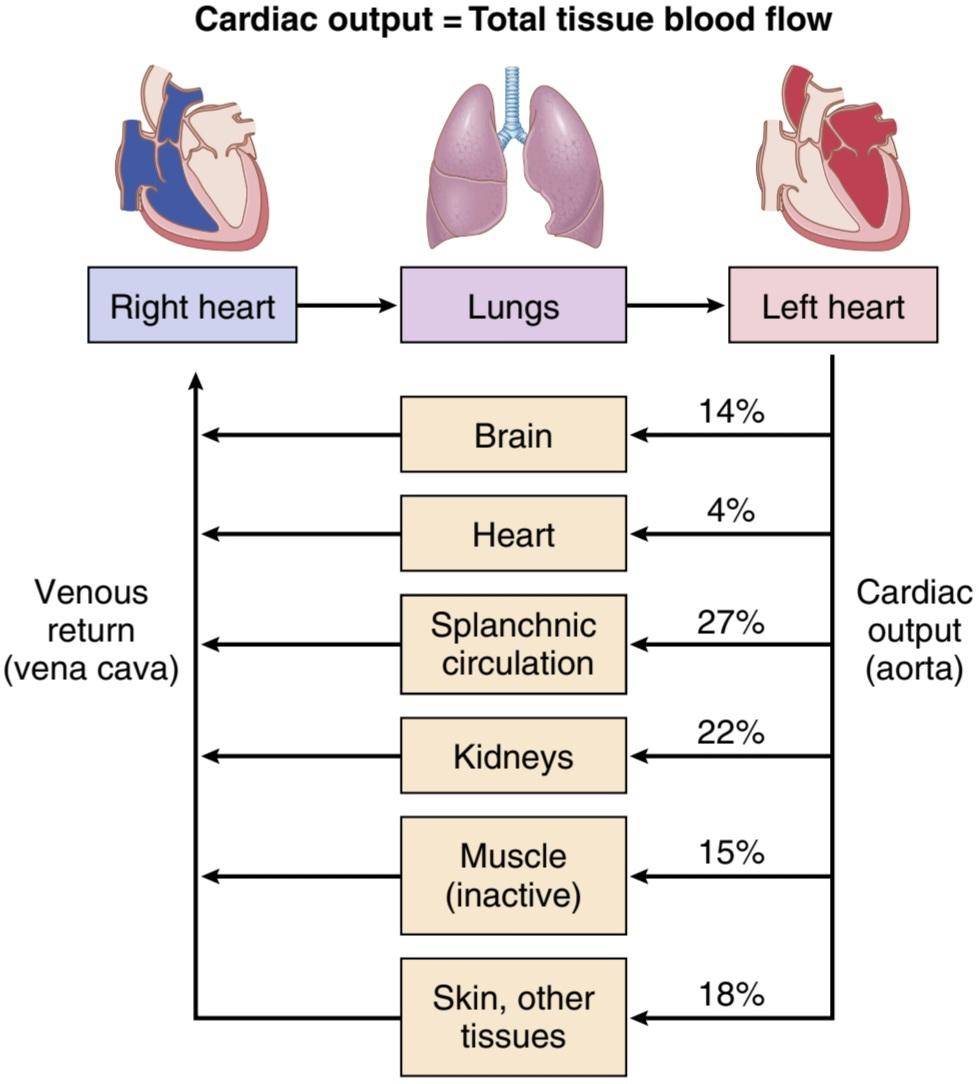
Figure 20-2. Cardiac output is equal to venous return and is the sum of tissue and organ blood flows. Except when the heart is severely weakened and unable to pump the venous return adequately, cardiac output (total tissue blood flow) is determined mainly by the metabolic needs of the tissues and organs of the body.
شکل 20-2. برون ده قلبی برابر است با بازگشت وریدی و مجموع جریان خون بافت و اندام است. به جز زمانی که قلب به شدت ضعیف شده و قادر به پمپاژ برگشت وریدی به اندازه کافی نباشد، برون ده قلبی (جریان خون کلی بافت) عمدتاً توسط نیازهای متابولیکی بافت ها و اندام های بدن تعیین می شود.
Cardiac Output Varies Inversely With Total Peripheral Resistance When Arterial Pressure Is Unchanged. Figure 20-3 is the same as Figure 19-5. It is repeated here to illustrate an extremely important principle in cardiac output control: Under many conditions, the long-term cardiac output level varies reciprocally with changes in total peripheral vascular resistance as long as the arterial pressure is unchanged. Note in Figure 20-4 that when the total peripheral resistance is exactly normal (at the 100% mark in the figure), the cardiac output is also normal. Then, when the total peripheral resistance increases above normal, the cardiac output falls; conversely, when the total peripheral resistance decreases, the cardiac out- put increases. One can easily understand this phenomenon by reconsidering one of the forms of Ohm’s law, as expressed in Chapter 14:
برون ده قلب برعکس با مقاومت کلی محیطی زمانی که فشار شریانی تغییر نمی کند متفاوت است. شکل 20-3 مانند شکل 19-5 است. در اینجا برای نشان دادن یک اصل بسیار مهم در کنترل برون ده قلبی تکرار شده است: در بسیاری از شرایط، سطح برون ده قلبی طولانی مدت به طور متقابل با تغییر در مقاومت عروق محیطی کلی تا زمانی که فشار شریانی بدون تغییر است تغییر می کند. در شکل 20-4 توجه داشته باشید که وقتی مقاومت کلی محیطی دقیقاً طبیعی است (در علامت 100٪ در شکل)، برون ده قلبی نیز نرمال است. سپس، هنگامی که مقاومت کلی محیطی بالاتر از حد طبیعی افزایش می یابد، برون ده قلبی کاهش می یابد. برعکس، وقتی مقاومت کلی محیطی کاهش می یابد، برون ده قلبی افزایش می یابد. با تجدید نظر در یکی از اشکال قانون اهم، همانطور که در فصل 14 بیان شد، می توان به راحتی این پدیده را درک کرد:
Thus, any time the long-term level of total peripheral resistance changes (but no other functions of the circulation change), the cardiac output changes quantitatively in exactly the opposite direction.
بنابراین، هر زمان که سطح بلندمدت مقاومت کلی محیطی تغییر کند (اما هیچ عملکرد دیگری از گردش خون تغییر نمی کند)، برون ده قلبی دقیقاً در جهت مخالف به طور کمی تغییر می کند.
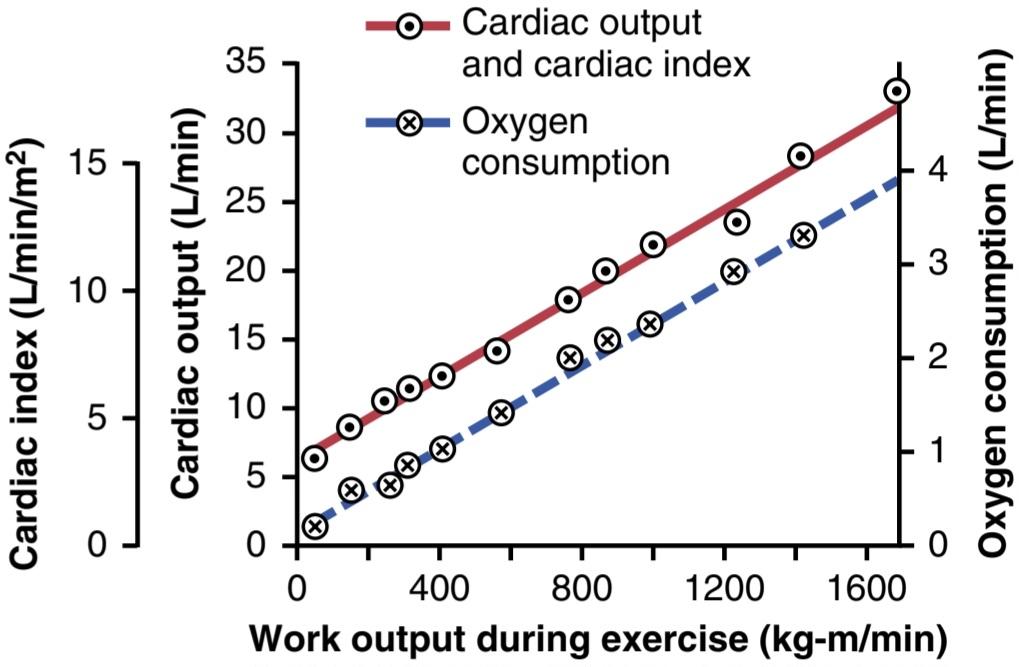
Figure 20-3. Effect of increasing levels of exercise to increase cardiac output (red solid line) and oxygen consumption (blue dashed line). (Modified from Guyton AC, Jones CE, Coleman TG: Circulatory Physiology: Cardiac Output and Its Regulation, 2nd ed. Philadelphia: WB Saunders, 1973.)
شکل 20-3. تأثیر افزایش سطوح ورزش بر افزایش برون ده قلبی (خط جامد قرمز) و مصرف اکسیژن (خط چین آبی). (اصلاح شده از Guyton AC, Jones CE, Coleman TG: Circulation Physiology: Cardiac Output and Itsregulation, ed. 2nd. Philadelphia: WB Saunders, 1973.)
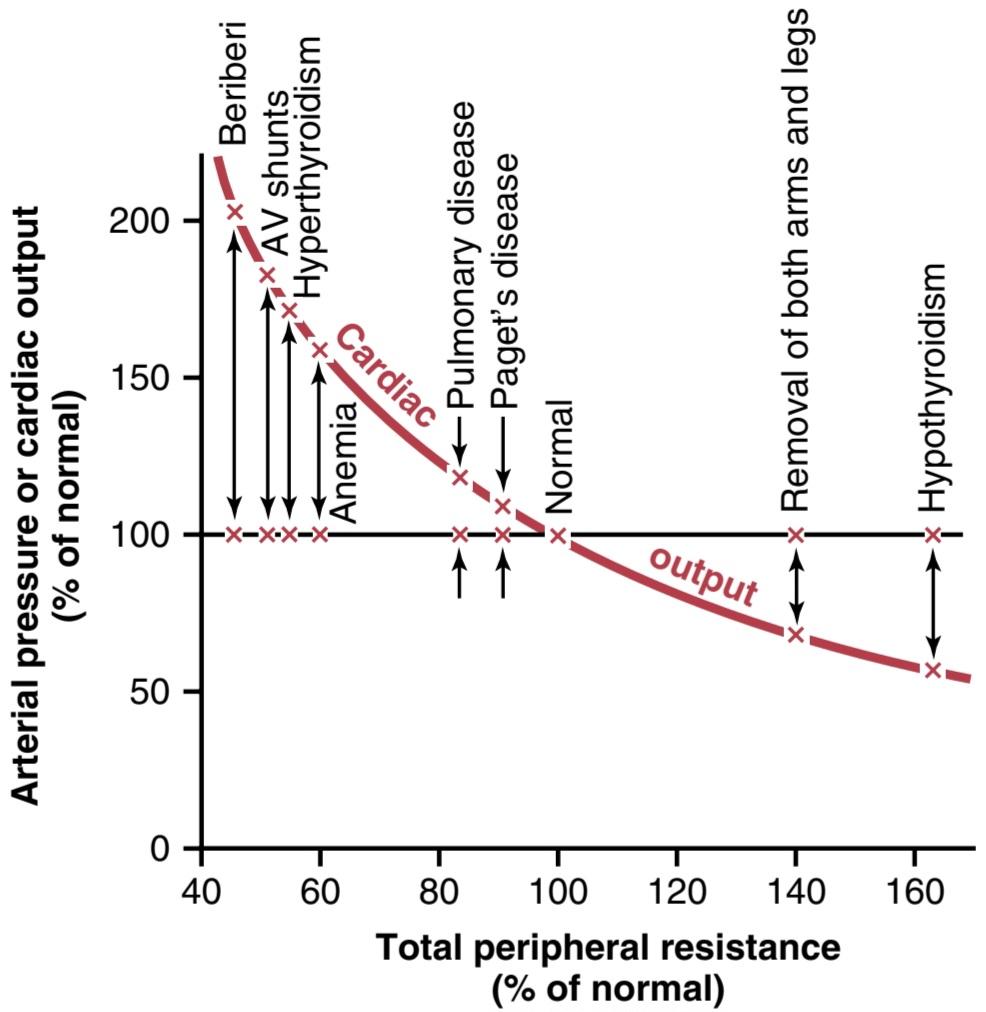
Figure 20-4. Chronic effect of different levels of total peripheral resistance on cardiac output, showing a reciprocal relationship between total peripheral resistance and cardiac output. AV, Atrioventricular. (Modified from Guyton AC: Arterial Pressure and Hypertension. Philadelphia: WB Saunders, 1980.)
شکل 20-4. اثر مزمن سطوح مختلف مقاومت محیطی کل بر برون ده قلبی، نشان دهنده رابطه متقابل بین مقاومت کلی محیطی و برون ده قلبی است. AV، دهلیزی بطنی. (اصلاح شده از Guyton AC: Arerial Pressure and Hypertension. Philadelphia: WB Saunders, 1980.)
Limits for the Cardiac Output
There are definite limits to the amount of blood that the heart can pump, which can be expressed quantitatively in the form of cardiac output curves.
محدودیت برای برون ده قلبی
محدودیت های مشخصی برای مقدار خونی که قلب می تواند پمپ کند وجود دارد که می تواند به صورت کمی در قالب منحنی های برون ده قلبی بیان شود.
Figure 20-5 demonstrates the normal cardiac output curve, showing the cardiac output per minute at each level of right atrial pressure. This is one type of cardiac function curve, which was discussed in Chapter 9. Note that the plateau level of this normal cardiac output curve is about 13 L/min, 2.5 times the normal cardiac output of about 5 L/min. This means that the normal human heart, functioning without any special stimulation, can pump a venous return up to about 2.5 times the normal venous return before the heart becomes a limiting factor in the control of cardiac output.
شکل 20-5 منحنی برون ده قلبی طبیعی را نشان می دهد و برون ده قلبی را در هر دقیقه در هر سطح از فشار دهلیز راست نشان می دهد. این یکی از انواع منحنی عملکرد قلب است که در فصل 9 مورد بحث قرار گرفت. توجه داشته باشید که سطح فلات این منحنی برون ده قلبی طبیعی حدود 13 لیتر در دقیقه است، یعنی 2.5 برابر برون ده قلبی طبیعی در حدود 5 لیتر در دقیقه. این بدان معناست که قلب طبیعی انسان، بدون هیچ گونه تحریک خاصی کار می کند، می تواند قبل از اینکه قلب به یک عامل محدود کننده در کنترل برون ده قلبی تبدیل شود، بازگشت وریدی را تا حدود 2.5 برابر بازگشت وریدی طبیعی پمپ کند.
Shown in Figure 20-5 are several other cardiac output curves for hearts that are not pumping normally. The uppermost curves are for hypereffective hearts that are pumping better than normal. The lowermost curves are for hypoeffective hearts that are pumping at levels below normal. Factors That Cause a Hypereffective Heart Two general types of factors that can make the heart a stronger pump than normal are nervous stimulation and hypertrophy of the heart muscle.
در شکل 20-5 چندین منحنی دیگر برون ده قلبی برای قلب هایی که به طور طبیعی پمپاژ نمی کنند نشان داده شده است. بالاترین منحنی ها برای قلب های بیش از حد موثر است که بهتر از حد معمول پمپاژ می کنند. پایین ترین منحنی ها برای قلب های کم اثر است که در سطوح پایین تر از نرمال پمپاژ می کنند. عواملی که باعث ایجاد یک قلب بیش از حد موثر می شوند دو نوع کلی از عواملی که می توانند قلب را به پمپ قوی تر از حد طبیعی تبدیل کنند، تحریک عصبی و هیپرتروفی عضله قلب هستند.
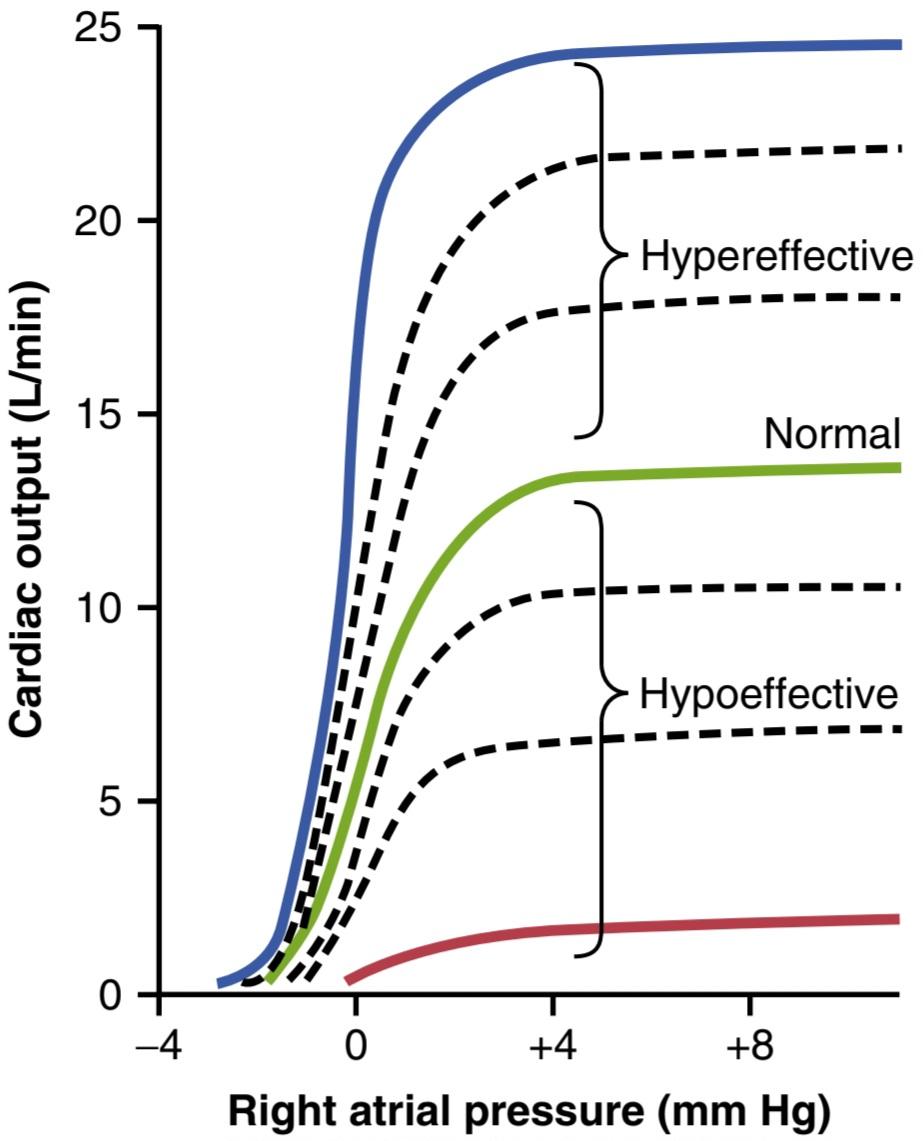
Figure 20-5. Cardiac output curves for the normal heart and for hypoeffective and hypereffective hearts. (Modified from Guyton AC, Jones CE, Coleman TG: Circulatory Physiology: Cardiac Output and Its Regulation, 2nd ed. Philadelphia: WB Saunders, 1973.)
شکل 20-5. منحنی های برون ده قلبی برای قلب طبیعی و برای قلب های کم اثر و بیش موثر. (اصلاح شده از Guyton AC, Jones CE, Coleman TG: Circulation Physiology: Cardiac Output and Itsregulation, ed. 2nd. Philadelphia: WB Saunders, 1973.)
Nervous Excitation Can Increase Heart Pumping. In Chapter 9, we saw that a combination of sympathetic stimulation and parasympathetic inhibition does two things to increase the pumping effectiveness of the heart: (1) it greatly increases the heart rate-sometimes, in young people, from the normal level of 72 beats/min up to 180 to 200 beats/min-and (2) it increases the strength of heart contraction (called increased contractility) to twice its normal strength. Combining these two effects, maximal nervous excitation of the heart can raise the plateau level of the cardiac output curve to almost twice the plateau of the normal curve, as shown by the 25-L/min level of the uppermost curve in Figure 20-5.
تحریک عصبی می تواند پمپاژ قلب را افزایش دهد. در فصل 9، دیدیم که ترکیبی از تحریک سمپاتیک و مهار پاراسمپاتیک دو کار را برای افزایش اثربخشی پمپاژ قلب انجام می دهد: (1) ضربان قلب را به شدت افزایش می دهد – گاهی اوقات، در افراد جوان، از سطح طبیعی 72 ضربان در دقیقه تا 180 تا 200 ضربان قلب (200 ضربان) افزایش انقباض آن را افزایش می دهد. به دو برابر قدرت طبیعی خود. با ترکیب این دو اثر، حداکثر تحریک عصبی قلب می تواند سطح فلات منحنی برون ده قلبی را تقریباً دو برابر منحنی طبیعی افزایش دهد، همانطور که با سطح 25-L/min بالاترین منحنی در شکل 20-5 نشان داده شده است.
Heart Hypertrophy Can Increase Pumping Effectiveness. A long-term increased workload, but not so much excess load that it damages the heart, causes the heart muscle to increase in mass and contractile strength in the same way that heavy exercise causes skeletal muscles to hypertrophy. For example, the hearts of marathon runners may be increased in mass by 50% to 75%. This factor increases the plateau level of the cardiac output curve, sometimes 60% to 100%, and therefore allows the heart to pump much greater than the usual amounts of cardiac output.
هیپرتروفی قلب می تواند کارایی پمپاژ را افزایش دهد. افزایش بار کاری طولانی مدت، اما نه آنقدر بار اضافی که به قلب آسیب برساند، باعث افزایش جرم و قدرت انقباضی عضله قلب می شود، همانطور که ورزش سنگین باعث هیپرتروفی عضلات اسکلتی می شود. برای مثال، حجم قلب دوندگان ماراتن ممکن است بین 50 تا 75 درصد افزایش یابد. این عامل سطح فلات منحنی برون ده قلبی را افزایش می دهد، گاهی اوقات 60٪ تا 100٪، و بنابراین به قلب اجازه می دهد تا بسیار بیشتر از مقادیر معمول برون ده قلبی پمپاژ کند.
When one combines nervous excitation of the heart and hypertrophy, as occurs in marathon runners, the total effect can allow the heart to pump as much 30 to 40 L/min, about 2.5 times the level that can be achieved in the average person. This increased level of pumping is one of the most important factors in determining the runner’s running time.
هنگامی که فرد تحریک عصبی قلب و هیپرتروفی را با هم ترکیب می کند، همانطور که در دوندگان ماراتن اتفاق می افتد، اثر کلی می تواند به قلب اجازه دهد 30 تا 40 لیتر در دقیقه پمپاژ کند، حدود 2.5 برابر سطحی که در یک فرد معمولی می تواند به دست آورد. این افزایش سطح پمپاژ یکی از مهمترین عوامل در تعیین زمان دویدن دونده است.
Factors That Cause a Hypoeffective Heart
Any factor that decreases the heart’s ability to pump blood causes hypoeffectivity. Some of the factors that can decrease the heart’s ability to pump blood are the following:
عواملی که باعث ایجاد قلب کم اثر می شود
هر عاملی که توانایی قلب برای پمپاژ خون را کاهش دهد باعث کاهش اثربخشی می شود. برخی از عواملی که می توانند توانایی قلب برای پمپاژ خون را کاهش دهند عبارتند از:
• Increased arterial pressure against which the heart must pump, such as in severe hypertension
• Inhibition of nervous excitation of the heart
• Pathological factors that cause abnormal heart rhythm or rate of heartbeat
• Coronary artery blockage, causing a heart attack
• Valvular heart disease
• Congenital heart disease
• Myocarditis, an inflammation of the heart muscle
• Cardiac hypoxia
• افزایش فشار شریانی که قلب باید در برابر آن پمپاژ کند، مانند فشار خون شدید
• مهار تحریک عصبی قلب
• عوامل پاتولوژیک که باعث ریتم غیر طبیعی قلب یا ضربان قلب می شوند
• انسداد عروق کرونر، باعث حمله قلبی می شود
• بیماری دریچه ای قلب
• بیماری قلبی مادرزادی
• میوکاردیت، التهاب عضله قلب
• هیپوکسی قلبی
NERVOUS SYSTEM REGULATION OF CARDIAC OUTPUT
تنظیم سیستم عصبی برون ده قلبی
Importance of Nervous System For Maintaining Arterial Pressure When Peripheral Blood Vessels Are Dilated and Venous Return and Cardiac Output Increase. Figure 20-6 shows an important difference in cardiac output control with and without a functioning autonomic nervous system. The solid curves demonstrate the effect in the normal dog of intense dilation of the peripheral blood vessels caused by administering the drug dinitrophenol, which increased the metabolism of virtually all tissues of the body about fourfold. With nervous control mechanisms intact, dilating all the peripheral blood vessels caused almost no change in arterial pressure but increased the cardiac output almost fourfold. However, after autonomic control of the nervous system was blocked, vasodilation of the blood vessels with dinitrophenol (dashed curves) then caused a profound fall in arterial pressure to about one-half normal, and the cardiac output increased only 1.6-fold instead of fourfold.
اهمیت سیستم عصبی برای حفظ فشار شریانی هنگامی که عروق خونی محیطی گشاد شده و بازگشت وریدی و برون ده قلبی افزایش می یابد. شکل 20-6 تفاوت مهمی را در کنترل برون ده قلبی با و بدون عملکرد سیستم عصبی خودمختار نشان می دهد. منحنی های جامد اثر اتساع شدید رگ های خونی محیطی را در سگ طبیعی نشان می دهد که ناشی از تجویز داروی دینیتروفنول است که متابولیسم تقریباً تمام بافت های بدن را حدود چهار برابر افزایش می دهد. با دست نخورده بودن مکانیسم های کنترل عصبی، گشاد شدن تمام رگ های خونی محیطی تقریباً تغییری در فشار شریانی ایجاد نکرد، اما برون ده قلبی را تقریباً چهار برابر افزایش داد. با این حال، پس از مسدود شدن کنترل اتونومیک سیستم عصبی، گشاد شدن عروق خونی با دییتروفنل (منحنیهای شکسته) باعث کاهش شدید فشار شریانی به حدود یک دوم نرمال شد و برون ده قلبی به جای چهار برابر، تنها 1.6 برابر افزایش یافت.
Thus, maintenance of a normal arterial pressure by the nervous system reflexes, by mechanisms explained in Chapter 18, is essential to achieve high cardiac outputs when the peripheral tissues dilate their blood vessels to increase the venous return.
بنابراین، حفظ فشار شریانی طبیعی توسط رفلکسهای سیستم عصبی، با مکانیسمهایی که در فصل 18 توضیح داده شد، برای دستیابی به برون ده قلبی بالا زمانی که بافتهای محیطی رگهای خونی خود را گشاد میکنند تا بازگشت وریدی را افزایش دهند، ضروری است.
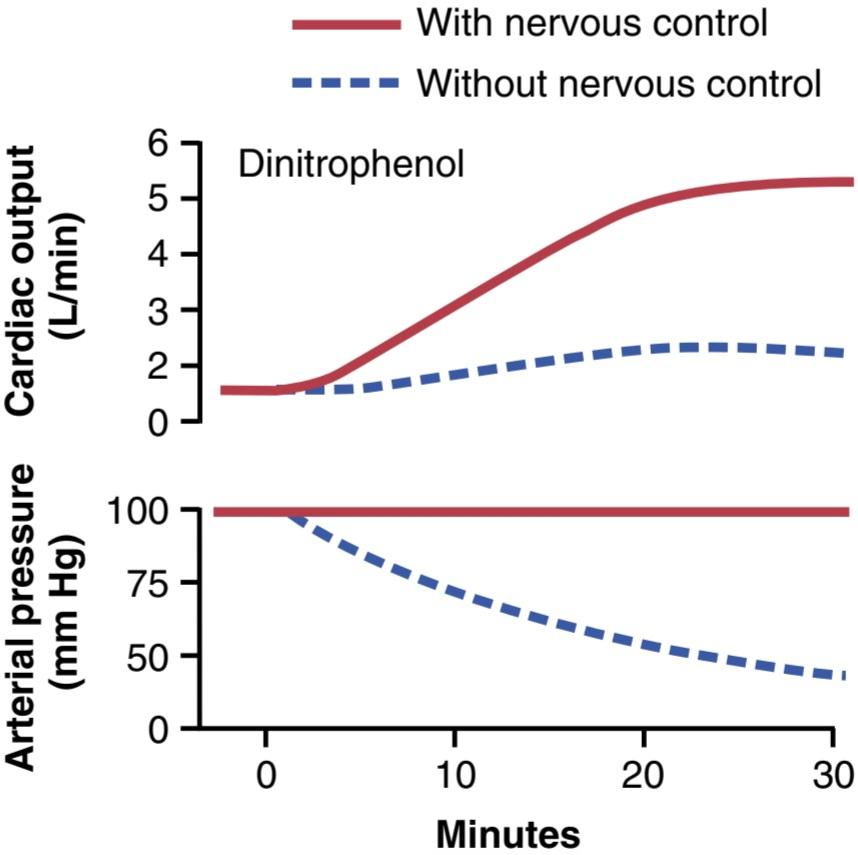
Figure 20-6. Experiment in a dog to demonstrate the importance of nervous maintenance of the arterial pressure as a prerequisite for cardiac output control. Note that with pressure control, the metabolic stimulant dinitrophenol increased cardiac output greatly, without pressure control, the arterial pressure fell, and the cardiac output increased very little. (Drawn from experiments by Dr. M. Banet.)
شکل 20-6. آزمایش در سگ برای نشان دادن اهمیت حفظ عصبی فشار شریانی به عنوان پیش نیاز برای کنترل برون ده قلبی. توجه داشته باشید که با کنترل فشار، دینیتروفنول محرک متابولیک برون ده قلبی را به شدت افزایش داد، بدون کنترل فشار، فشار شریانی کاهش یافت و برون ده قلبی بسیار کم افزایش یافت. (برگرفته از آزمایشات دکتر M. Banet.)
Effect of Nervous System to Increase Arterial Pressure During Exercise. During exercise, intense increases in metabolism in active skeletal muscles cause relaxation of muscle arterioles to allow adequate oxygen and other nutrients needed to sustain muscle contraction. This greatly decreases the total peripheral resistance, which normally would decrease the arterial pressure as well. However, the nervous system immediately compensates. The same brain activity that sends motor signals to the muscles sends simultaneous signals into the autonomic nervous centers of the brain to excite circulatory activity, causing large vein constriction, increased heart rate, and increased contractility of the heart. All these changes acting together increase the arterial pressure above normal, which in turn forces still more blood flow through the active muscles.
تاثیر سیستم عصبی در افزایش فشار شریانی در حین ورزش. در طول ورزش، افزایش شدید متابولیسم در عضلات اسکلتی فعال باعث شل شدن شریانهای عضلانی میشود تا اکسیژن کافی و سایر مواد مغذی مورد نیاز برای حفظ انقباض عضلانی فراهم شود. این امر مقاومت کلی محیطی را تا حد زیادی کاهش می دهد، که به طور معمول فشار شریانی را نیز کاهش می دهد. با این حال، سیستم عصبی بلافاصله جبران می کند. همان فعالیت مغزی که سیگنالهای حرکتی را به ماهیچهها میفرستد، سیگنالهای همزمان را به مراکز عصبی خودمختار مغز میفرستد تا فعالیت گردش خون را تحریک کند و باعث انقباض سیاهرگ بزرگ، افزایش ضربان قلب و افزایش انقباض قلب شود. همه این تغییرات با هم عمل می کنند فشار شریانی را بالاتر از حد طبیعی افزایش می دهند که به نوبه خود جریان خون بیشتری را در ماهیچه های فعال مجبور می کند.
In summary, when local tissue blood vessels dilate and increase venous return and cardiac output above normal, the nervous system plays a key role in preventing the arterial pressure from falling to disastrously low levels. During exercise, the nervous system goes even further, providing additional signals to raise the arterial pressure above normal, which serves to increase the cardiac output an extra 30% to 100%.
به طور خلاصه، زمانی که رگهای خونی بافت محلی منبسط میشوند و بازگشت وریدی و برون ده قلبی را بیش از حد طبیعی افزایش میدهند، سیستم عصبی نقش کلیدی در جلوگیری از کاهش فشار شریانی به سطوح پایین فاجعهبار ایفا میکند. در حین ورزش، سیستم عصبی از این هم فراتر می رود و سیگنال های اضافی را برای بالا بردن فشار شریانی بالاتر از حد طبیعی ارائه می دهد که باعث افزایش برون ده قلبی 30 تا 100 درصد می شود.
Pathologically High or Low Cardiac Outputs
Multiple clinical abnormalities can cause either high or low cardiac outputs. Some of the more important of these ab- normal cardiac outputs are shown in Figure 20-7.
برون ده قلبی بالا یا پایین پاتولوژیک
ناهنجاری های بالینی متعدد می تواند باعث برون ده قلبی بالا یا پایین شود. برخی از مهمترین این برون ده های قلبی غیر طبیعی در شکل 20-7 نشان داده شده است.
High Cardiac Output Caused by Reduced Total Peripheral Resistance
The left side of Figure 20-7 identifies conditions that cause abnormally high cardiac outputs. One of the distinguishing features of these conditions is that they all result from chronically reduced total peripheral resistance None of them result from excessive excitation of the heart itself, which we will explain subsequently. Let us consider some of the conditions that can decrease the peripheral resistance and at the same time increase the cardiac output to above normal.
برون ده قلبی بالا ناشی از کاهش مقاومت کلی محیطی
سمت چپ شکل 20-7 شرایطی را مشخص می کند که باعث برون ده قلبی غیرطبیعی می شود. یکی از ویژگیهای متمایز این بیماریها این است که همگی از کاهش مزمن مقاومت کلی محیطی ناشی میشوند که هیچکدام از آنها ناشی از تحریک بیش از حد خود قلب نیست، که در ادامه توضیح خواهیم داد. اجازه دهید برخی از شرایطی را در نظر بگیریم که می توانند مقاومت محیطی را کاهش دهند و در عین حال برون ده قلبی را به بالاتر از حد طبیعی افزایش دهند.
1. Beriberi. This disease is caused by insufficient quantity of the vitamin thiamine (vitamin B,) in the diet. Lack of this vitamin causes diminished ability of the tissues to use some cellular nutrients, and the local tissue blood flow control mechanisms in turn cause marked compensatory peripheral vasodilation. Sometimes the total peripheral resistance decreases to as little as half- normal. Consequently, the long-term levels of venous return and cardiac output also may increase to twice the normal value.
1.بری بری این بیماری به دلیل کمبود ویتامین تیامین (ویتامین B) در رژیم غذایی ایجاد می شود. کمبود این ویتامین باعث کاهش توانایی بافت ها برای استفاده از برخی مواد مغذی سلولی می شود و مکانیسم های کنترل جریان خون بافتی به نوبه خود باعث اتساع عروق محیطی جبرانی قابل توجهی می شود. گاهی اوقات مقاومت کلی محیطی تا نیمه نرمال کاهش می یابد. در نتیجه، سطوح طولانی مدت بازگشت وریدی و برون ده قلبی نیز ممکن است تا دو برابر مقدار طبیعی افزایش یابد.
2. Arteriovenous (AV) fistula (shunt). Earlier, we pointed out that whenever a fistula (also called an AV shunt) occurs between a major artery and major vein, large amounts of blood flow directly from the artery into the vein. This also greatly decreases the total peripheral resistance and, likewise, increases the venous return and cardiac output.
2.فیستول شریانی وریدی (AV) (شانت). قبلاً اشاره کردیم که هرگاه فیستول (همچنین به نام شانت AV) بین شریان اصلی و ورید اصلی رخ دهد، مقدار زیادی خون مستقیماً از شریان به داخل سیاهرگ جریان می یابد. این همچنین مقاومت کلی محیطی را تا حد زیادی کاهش می دهد و به همین ترتیب، بازگشت وریدی و برون ده قلبی را افزایش می دهد.
3. Hyperthyroidism. In hyperthyroidism, the metabolism of most tissues of the body becomes greatly increased. Oxygen usage increases, and vasodilator products are released from the tissues. Therefore, total peripheral resistance decreases markedly because of local tissue blood flow control reactions throughout the body; con- sequently, venous return and cardiac output often increase to 40% to 80% above normal.
3.پرکاری تیروئید در پرکاری تیروئید، متابولیسم اکثر بافت های بدن به شدت افزایش می یابد. مصرف اکسیژن افزایش می یابد و محصولات گشادکننده عروق از بافت ها آزاد می شوند. بنابراین، مقاومت کلی محیطی بهدلیل واکنشهای کنترل جریان خون بافتی در سرتاسر بدن، بطور قابل توجهی کاهش مییابد. در نتیجه، بازگشت وریدی و برون ده قلبی اغلب تا 40 تا 80 درصد بالاتر از حد طبیعی افزایش می یابد.
4. Anemia. In anemia, two peripheral effects greatly decrease total peripheral resistance. One of these effects is reduced viscosity of the blood, resulting from the decreased concentration of red blood cells. The other effect is diminished delivery of oxygen to the tissues, which causes local vasodilation. As a consequence, cardiac output increases greatly.
4. کم خونی. در کم خونی، دو اثر محیطی مقاومت کلی محیطی را تا حد زیادی کاهش می دهد. یکی از این اثرات کاهش ویسکوزیته خون است که در نتیجه کاهش غلظت گلبول های قرمز خون ایجاد می شود. اثر دیگر کاهش رساندن اکسیژن به بافت ها است که باعث اتساع موضعی عروق می شود. در نتیجه، برون ده قلبی به شدت افزایش می یابد.
Any other factor that decreases total peripheral resistance chronically also increases cardiac output if arterial pressure does not decrease too much.
هر عامل دیگری که مقاومت کلی محیطی را به طور مزمن کاهش دهد، اگر فشار شریانی بیش از حد کاهش نیابد، برون ده قلبی را افزایش می دهد.
Low Cardiac Output
Figure 20-7 shows at the far right several conditions that cause abnormally low cardiac output. These conditions fall into two categories: (1) abnormalities that decrease pumping effectiveness of the heart; and (2) those that decrease venous return.
برون ده قلبی کم
شکل 20-7 در منتهی الیه سمت راست شرایطی را نشان می دهد که باعث برون ده قلبی غیرطبیعی پایین می شوند. این شرایط به دو دسته تقسیم می شوند: (1) ناهنجاری هایی که کارایی پمپاژ قلب را کاهش می دهند. و (2) آنهایی که بازگشت وریدی را کاهش می دهند.
Decreased Cardiac Output Caused by Cardiac Factors.
Whenever the heart becomes severely damaged, regardless of the cause, its limited level of pumping may fall below that needed for adequate blood flow to the tissues. Some examples of this condition include the following: (1) severe coronary blood vessel blockage and consequent myocardial infarction; (2) severe valvular heart disease; (3) myocarditis; (4) cardiac tamponade; and (5) cardiac metabolic derangements. The effects of several of these conditions are shown on the right in Figure 20-7, demonstrating the low cardiac outputs that result.
کاهش برون ده قلبی ناشی از عوامل قلبی.
هر زمان که قلب بدون توجه به علت به شدت آسیب ببیند، سطح محدود پمپاژ آن ممکن است کمتر از میزان لازم برای جریان خون کافی به بافت ها باشد. برخی از نمونههای این وضعیت شامل موارد زیر است: (1) انسداد شدید عروق کرونر و در نتیجه انفارکتوس میوکارد. (2) بیماری شدید دریچه ای قلب؛ (3) میوکاردیت؛ (4) تامپوناد قلبی؛ و (5) اختلالات متابولیک قلبی. اثرات چندین مورد از این شرایط در سمت راست در شکل 20-7 نشان داده شده است که برون ده قلبی کم را نشان می دهد.
When the cardiac output falls so low that the tissues throughout the body begin to suffer nutritional deficiency, the condition is called cardiac shock. This condition is discussed in Chapter 22 in relationship to cardiac failure.
هنگامی که برون ده قلبی به قدری کم می شود که بافت های سراسر بدن دچار کمبود تغذیه ای می شوند، این وضعیت شوک قلبی نامیده می شود. این وضعیت در فصل 22 در رابطه با نارسایی قلبی مورد بحث قرار گرفته است.
Decreased Cardiac Output Caused by Noncardiac Peripheral Factors Decreased Venous Return. Anything that interferes with venous return also can lead to decreased cardiac output. Some of these factors are as follows:
کاهش برون ده قلبی ناشی از عوامل محیطی غیر قلبی کاهش بازگشت وریدی. هر چیزی که با بازگشت وریدی تداخل داشته باشد نیز می تواند منجر به کاهش برون ده قلبی شود. برخی از این عوامل به شرح زیر است:
1. Decreased blood volume. The most common noncardiac peripheral factor that leads to decreased cardiac output is decreased blood volume, often from hemorrhage. Loss of blood may decrease the filling of the vascular system to such a low level that there is not enough blood in the peripheral vessels to create peripheral vascular pressures high enough to push the blood back to the heart.
1. کاهش حجم خون. شایع ترین عامل محیطی غیر قلبی که منجر به کاهش برون ده قلبی می شود، کاهش حجم خون است که اغلب ناشی از خونریزی است. از دست دادن خون ممکن است پر شدن سیستم عروقی را به حدی کم کند که خون کافی در رگ های محیطی وجود نداشته باشد تا فشار عروق محیطی به اندازه کافی بالا باشد تا خون را به سمت قلب برگرداند.
2. Acute venous dilation. Acute venous dilation results most often when the sympathetic nervous system suddenly becomes inactive. For example, fainting often results from sudden loss of sympathetic nervous system activity, which causes the peripheral capacitative vessels, especially the veins, to dilate markedly. This dilation decreases the filling pressure of the vascular system because the blood volume can no longer create adequate pressure in the now flaccid peripheral blood vessels. As a result, the blood pools in the vessels and does not return to the heart as rapidly as normal.
2. اتساع حاد وریدی. اتساع حاد سیاهرگی اغلب زمانی رخ می دهد که سیستم عصبی سمپاتیک به طور ناگهانی غیرفعال می شود. به عنوان مثال، غش اغلب ناشی از از دست دادن ناگهانی فعالیت سیستم عصبی سمپاتیک است، که باعث می شود عروق خازنی محیطی، به ویژه وریدها، به طور قابل توجهی گشاد شوند. این اتساع فشار پر شدن سیستم عروقی را کاهش می دهد زیرا حجم خون دیگر نمی تواند فشار کافی را در رگ های خونی محیطی شل شده ایجاد کند. در نتیجه خون در رگ ها جمع می شود و به سرعت عادی به قلب باز نمی گردد.
3. Obstruction of the large veins. On rare occasions, the large veins leading into the heart become obstructed, and the blood in the peripheral vessels cannot flow back into the heart. Consequently, the cardiac output falls markedly.
3. انسداد وریدهای بزرگ. در موارد نادر، سیاهرگهای بزرگی که به قلب منتهی میشوند مسدود میشوند و خون در رگهای محیطی نمیتواند به قلب برگردد. در نتیجه، برون ده قلبی به طور قابل توجهی کاهش می یابد.
4. Decreased tissue mass, especially decreased skeletal muscle mass. With normal aging or with prolonged periods of physical inactivity, a reduction in the size of the skeletal muscles usually occurs. This reduction, in turn, decreases the total oxygen consumption and blood flow needs of the muscles, resulting in decreases in skeletal muscle blood flow and cardiac output.
4. کاهش توده بافتی به ویژه کاهش توده عضلانی اسکلتی. با افزایش سن طبیعی یا با دوره های طولانی عدم فعالیت بدنی، معمولاً کاهش اندازه عضلات اسکلتی رخ می دهد. این کاهش، به نوبه خود، مصرف کل اکسیژن و نیاز به جریان خون ماهیچه ها را کاهش می دهد و در نتیجه باعث کاهش جریان خون ماهیچه های اسکلتی و برون ده قلبی می شود.
5. Decreased metabolic rate of the tissues. If the tissue metabolic rate is reduced, as occurs in skeletal muscle during prolonged bed rest, the oxygen consumption and nutrition needs of the tissues will also be lower, which decreases blood flow to the tissues, resulting in reduced cardiac output. Other conditions, such as hypothyroidism, may also reduce metabolic rate and therefore tissue blood flow and cardiac output.
5. کاهش سرعت متابولیسم بافت ها. اگر میزان متابولیک بافت کاهش یابد، همانطور که در ماهیچه های اسکلتی در طول استراحت طولانی مدت رخ می دهد، مصرف اکسیژن و نیازهای تغذیه ای بافت ها نیز کاهش می یابد که باعث کاهش جریان خون به بافت ها و در نتیجه کاهش برون ده قلبی می شود. سایر شرایط مانند کم کاری تیروئید نیز ممکن است سرعت متابولیسم و در نتیجه جریان خون بافت و برون ده قلبی را کاهش دهد.
Regardless of the cause of low cardiac output, whether it is a peripheral factor or a cardiac factor, if the cardiac output ever falls below the level required for adequate nutrition of the tissues, the person is said to experience circulatory shock. This condition can be lethal within a few minutes to a few hours. Circulatory shock is such an important clinical problem that it is discussed in detail in Chapter 24.
صرف نظر از علت برون ده قلبی پایین، چه یک عامل محیطی باشد یا یک عامل قلبی، اگر برون ده قلبی کمتر از سطح مورد نیاز برای تغذیه کافی بافت ها باشد، گفته می شود که فرد شوک گردش خون را تجربه می کند. این وضعیت می تواند در عرض چند دقیقه تا چند ساعت کشنده باشد. شوک گردش خون چنان مشکل بالینی مهمی است که در فصل 24 به تفصیل مورد بحث قرار گرفته است.

Figure 20-7. Cardiac output in different pathological conditions. The numbers in parentheses indicate the number of patients studied in each condition. AV, Atrioventricular. (Modified from Guyton AC, Jones CE, Coleman TG: Circulatory Physiology: Cardiac Output and Its Regulation, 2nd ed. Philadelphia: WB Saunders, 1973.)
شکل 20-7. برون ده قلبی در شرایط مختلف پاتولوژیک اعداد داخل پرانتز تعداد بیماران مورد مطالعه در هر شرایط را نشان می دهد. AV، دهلیزی بطنی. (اصلاح شده از Guyton AC, Jones CE, Coleman TG: Circulation Physiology: Cardiac Output and Itsregulation, ed. 2nd. Philadelphia: WB Saunders, 1973.)
CARDIAC OUTPUT CURVES USED IN QUANTITATIVE ANALYSIS OF CARDIAC OUTPUT REGULATION
Our discussion of cardiac output regulation thus far is adequate for understanding the factors that control cardiac output in most simple conditions. However, to understand cardiac output regulation in especially stressful situations, such as the extremes of exercise, cardiac failure, and circulatory shock, a more complex quantitative analysis is presented in the following sections.
منحنی های برون ده قلبی مورد استفاده در تجزیه و تحلیل کمی تنظیم برون ده قلبی
بحث ما در مورد تنظیم برون ده قلبی تاکنون برای درک عواملی که برون ده قلبی را در اکثر شرایط ساده کنترل می کنند، کافی است. با این حال، برای درک تنظیم برون ده قلبی در موقعیت های خاص استرس زا، مانند ورزش شدید، نارسایی قلبی، و شوک گردش خون، تجزیه و تحلیل کمی پیچیده تر در بخش های زیر ارائه شده است.
To perform the more quantitative analysis, it is necessary to distinguish separately the two primary factors concerned with cardiac output regulation: (1) the pumping ability of the heart, as represented by cardiac output curves; and (2) the peripheral factors that affect flow of blood from the veins into the heart, as represented by venous return curves. Then we can put these curves together in a quantitative way to show how they interact with each other to determine cardiac output, venous return, and right atrial pressure at the same time.
برای انجام تجزیه و تحلیل کمی بیشتر، لازم است دو عامل اصلی مربوط به تنظیم برون ده قلبی را به طور جداگانه متمایز کنیم: (1) توانایی پمپاژ قلب، همانطور که توسط منحنی های برون ده قلبی نشان داده می شود. و (2) عوامل محیطی که بر جریان خون از سیاهرگها به قلب تأثیر میگذارند، همانطور که با منحنیهای بازگشت وریدی نشان داده میشوند. سپس میتوانیم این منحنیها را به روش کمی کنار هم قرار دهیم تا نشان دهیم که چگونه با یکدیگر برای تعیین برون ده قلبی، بازگشت وریدی و فشار دهلیز راست به طور همزمان تعامل دارند.
Some of the cardiac output curves used to depict quantitative heart pumping effectiveness have already been shown in Figure 20-5. However, an additional set of curves is required to show the effect on cardiac output caused by changing external pressures on the outside of the heart, as explained in the next section.
برخی از منحنی های برون ده قلبی که برای نشان دادن اثربخشی کمی پمپاژ قلب استفاده می شود قبلاً در شکل 20-5 نشان داده شده است. با این حال، مجموعه ای از منحنی های اضافی برای نشان دادن تأثیر بر برون ده قلبی ناشی از تغییر فشارهای خارجی در قسمت بیرونی قلب لازم است، همانطور که در بخش بعدی توضیح داده شد.
Effect of External Pressure Outside the Heart on Cardiac Output Curves. Figure 20-8 shows the effect of changes in external cardiac pressure on the cardiac output curve. The normal external pressure is equal to the normal intrapleural pressure (the pressure in the chest cavity), which is about -4 mm Hg. Note in the figure that a rise in intrapleural pressure, to -2 mm Hg, shifts the entire cardiac output curve to the right by the same amount. This shift occurs because filling the cardiac chambers with blood requires an extra 2 mm Hg of right atrial pressure to overcome the increased pressure on the outside of the heart. Likewise, an increase in intrapleural pressure to +2 mm Hg requires a 6 mm Hg increase in right atrial pressure from the normal -4 mm Hg, which shifts the entire cardiac output curve 6 mm Hg to the right.
تأثیر فشار خارجی خارج از قلب بر منحنی های برون ده قلبی. شکل 20-8 اثر تغییرات فشار خارجی قلب را بر روی منحنی برون ده قلبی نشان می دهد. فشار خارجی طبیعی برابر با فشار طبیعی داخل پلورال (فشار در حفره قفسه سینه) است که حدود -4 میلی متر جیوه است. در شکل توجه داشته باشید که افزایش فشار داخل جنب به 2- میلی متر جیوه، کل منحنی برون ده قلبی را به همان میزان به سمت راست تغییر می دهد. این تغییر به این دلیل اتفاق میافتد که پر کردن حفرههای قلبی با خون به ۲ میلیمتر جیوه اضافی فشار دهلیز راست برای غلبه بر افزایش فشار در قسمت بیرونی قلب نیاز دارد. به همین ترتیب، افزایش فشار داخل جنب به +2 میلی متر جیوه نیاز به افزایش 6 میلی متر جیوه در فشار دهلیز راست از 4- میلی متر جیوه طبیعی دارد که کل منحنی برون ده قلبی را 6 میلی متر جیوه به سمت راست تغییر می دهد.
Some factors that can alter the external pressure on the heart and thereby shift the cardiac output curve are the following:
برخی از عواملی که می توانند فشار خارجی بر روی قلب را تغییر دهند و در نتیجه منحنی برون ده قلبی را تغییر دهند عبارتند از:
1. Cyclical changes of intrapleural pressure during respiration, which are about ±2 mm Hg during normal breathing but can be as much as ±50 mm Hg during strenuous breathing.
1. تغییرات چرخه ای فشار داخل پلورال در طول تنفس، که حدود ± 2 میلی متر جیوه در طول تنفس طبیعی است، اما می تواند تا 50 ± میلی متر جیوه در طول تنفس شدید باشد.
2. Breathing against a negative pressure, which shifts the curve to a more negative right atrial pressure (to the left).
2. تنفس در برابر فشار منفی، که منحنی را به فشار منفی تر دهلیز راست (به سمت چپ) تغییر می دهد.
3. Positive-pressure breathing, which shifts the curve to the right.
3. تنفس با فشار مثبت، که منحنی را به سمت راست تغییر می دهد.
4. Opening the thoracic cage, which increases the in- trapleural pressure to 0 mm Hg and shifts the cardiac output curve to the right by 4 mm Hg.
4. باز کردن قفس قفسه سینه، که فشار داخل پلورال را تا 0 میلی متر جیوه افزایش می دهد و منحنی برون ده قلبی را به میزان 4 میلی متر جیوه به سمت راست تغییر می دهد.
5. Cardiac tamponade, which means accumulation of a large quantity of fluid in the pericardial cavity around the heart with a resultant increase in external cardiac pressure and shifting of the curve to the right Note in Figure 20-8 that cardiac tamponade shifts the upper parts of the curves farther to the right than the lower parts because the external tamponade pressure rises to higher values as the chambers of the heart fill to increased volumes during high cardiac output.
5. تامپوناد قلبی، که به معنای تجمع مقدار زیادی مایع در حفره پریکارد در اطراف قلب همراه با افزایش فشار خارجی قلب و تغییر منحنی به سمت راست است در شکل 20-8 توجه داشته باشید که تامپوناد قلبی قسمتهای بالایی منحنیها را به سمت راست بیشتر از قسمتهای پایینتر تغییر میدهد، زیرا فشار بیرونی به سمت راست افزایش مییابد. پر شدن قلب تا افزایش حجم در طول برون ده قلبی بالا.

Figure 20-8. Cardiac output curves at different levels of intrapleural pressure and different degrees of cardiac tamponade. (Modified from Guyton AC, Jones CE, Coleman TG: Circulatory Physiology: Cardiac Output and Its Regulation, 2nd ed. Philadelphia: WB Saunders, 1973.)
شکل 20-8. منحنی برون ده قلبی در سطوح مختلف فشار داخل پلورال و درجات مختلف تامپوناد قلبی. (اصلاح شده از Guyton AC, Jones CE, Coleman TG: Circulation Physiology: Cardiac Output and Itsregulation, ed. 2nd. Philadelphia: WB Saunders, 1973.)
Combinations of Different Patterns of Cardiac Output Curves. Figure 20-9 shows that the final cardiac output curve can change as a result of simultaneous changes in the following: (1) external cardiac pressure; and (2) effectiveness of the heart as a pump. For example, the combination of a hypereffective heart and increased intrapleural pressure would lead to an increased maximum level of cardiac output due to the increased pumping capability of the heart, but the cardiac output curve would be shifted to the right (to higher atrial pressures) because of the increased intrapleural pressure. Thus, by knowing what is happening to the external pressure, and to the capability of the heart as a pump, one can express the momentary ability of the heart to pump blood by a single cardiac output curve.
ترکیبی از الگوهای مختلف منحنی برون ده قلبی. شکل 20-9 نشان می دهد که منحنی برون ده قلبی نهایی می تواند در نتیجه تغییرات همزمان در موارد زیر تغییر کند: (1) فشار قلبی خارجی. و (2) اثربخشی قلب به عنوان یک پمپ. به عنوان مثال، ترکیب یک قلب بیش از حد موثر و افزایش فشار داخل پلورال منجر به افزایش حداکثر سطح برون ده قلبی به دلیل افزایش قابلیت پمپاژ قلب می شود، اما منحنی برون ده قلبی به دلیل افزایش فشار داخل پلورال به سمت راست (به فشار دهلیزی بالاتر) منتقل می شود. بنابراین، با دانستن اینکه چه اتفاقی برای فشار خارجی و توانایی قلب به عنوان یک پمپ می افتد، می توان توانایی لحظه ای قلب برای پمپاژ خون را با یک منحنی برون ده قلبی بیان کرد.

Figure 20-9. Combinations of two major patterns of cardiac output curves showing the effect of alterations in both extracardiac pressure and effectiveness of the heart as a pump. (Modified from Guyton AC, Jones CE, Coleman TG: Circulatory Physiology: Cardiac Output and Its Regulation, 2nd ed. Philadelphia: WB Saunders, 1973.)
شکل 20-9. ترکیبی از دو الگوی اصلی منحنی برون ده قلبی که اثر تغییرات در فشار خارج از قلب و اثربخشی قلب به عنوان یک پمپ را نشان می دهد. (اصلاح شده از Guyton AC, Jones CE, Coleman TG: Circulation Physiology: Cardiac Output and Itsregulation, ed. 2nd. Philadelphia: WB Saunders, 1973.)
VENOUS RETURN CURVES
The entire systemic circulation must be considered before complete analysis of cardiac regulation can be achieved. To analyze the function of the systemic circulation experimentally, the heart and lungs were removed from the circulation of an animal and replaced with a pump and artificial oxygenator system. Then, different factors, such as blood volume, vascular resistances, and central venous pressure in the right atrium, were altered to determine how the systemic circulation operates in different circulatory states. From these studies, one finds the following three principal factors that affect venous return to the heart from the systemic circulation:
منحنی های بازگشت وریدی
کل گردش خون سیستمیک باید قبل از تجزیه و تحلیل کامل تنظیم قلبی در نظر گرفته شود. برای تجزیه و تحلیل تجربی عملکرد گردش خون سیستمیک، قلب و ریه ها از گردش خون حیوان خارج شد و با یک پمپ و سیستم اکسیژن ساز مصنوعی جایگزین شد. سپس، عوامل مختلفی مانند حجم خون، مقاومتهای عروقی، و فشار وریدی مرکزی در دهلیز راست، برای تعیین نحوه عملکرد گردش خون سیستمیک در حالات مختلف گردش خون تغییر داده شدند. از این مطالعات، سه عامل اصلی زیر را مییابیم که بر بازگشت وریدی به قلب از گردش خون سیستمیک تأثیر میگذارند:
1. Right atrial pressure, which exerts a backward force on the veins to impede flow of blood from the veins into the right atrium.
1. فشار دهلیز راست، که نیرویی رو به عقب بر وریدها وارد می کند تا مانع از جریان خون از سیاهرگ ها به دهلیز راست شود.
2. Degree of filling of the systemic circulation (measured by the mean systemic filling pressure), which forces the systemic blood toward the heart (this is the pressure measured everywhere in the systemic circulation when all flow of blood is stopped, dis- cussed in detail later).
2. درجه پر شدن گردش خون سیستمیک (اندازه گیری شده با فشار پرشدگی سیستمیک متوسط)، که خون سیستمیک را به سمت قلب وادار می کند (این فشاری است که در همه جای گردش خون سیستمیک اندازه گیری می شود زمانی که تمام جریان خون متوقف می شود، بعداً به تفصیل مورد بحث قرار می گیرد).
3. Resistance to blood flow between the peripheral vessels and the right atrium.
3. مقاومت در برابر جریان خون بین عروق محیطی و دهلیز راست.
These factors can all be expressed quantitatively by the venous return curve, as we explain in the next sections.
این عوامل را می توان به صورت کمی با منحنی بازگشت وریدی بیان کرد، همانطور که در بخش های بعدی توضیح می دهیم.
Normal Venous Return Curve
In the same way that the cardiac output curve relates pumping of blood by the heart to right atrial pressure, the venous return curve relates venous return also to right atrial pressure-that is, the venous flow of blood into the heart from the systemic circulation at different levels of right atrial pressure.
منحنی بازگشت وریدی طبیعی
همانطور که منحنی برون ده قلبی پمپاژ خون توسط قلب را به فشار دهلیز راست مرتبط می کند، منحنی بازگشت وریدی نیز بازگشت وریدی را به فشار دهلیز راست مرتبط می کند – یعنی جریان وریدی خون از گردش خون سیستمیک در سطوح مختلف فشار دهلیز راست به قلب.
The curve in Figure 20-10 is the normal venous return curve. This curve shows that when heart pumping capability becomes diminished and causes the right atrial pressure to rise, the backward force of the rising atrial pressure on the veins of the systemic circulation decreases venous return of blood to the heart. If all nervous circulatory reflexes are prevented from acting, venous return decreases to zero when the right atrial pressure rises to about +7 mm Hg. Such a slight rise in right atrial pressure causes a drastic decrease in venous return because any increase in back pressure causes blood to dam up in the systemic circulation instead of returning to the heart.
منحنی شکل 20-10 منحنی بازگشت وریدی طبیعی است. این منحنی نشان می دهد که وقتی توانایی پمپاژ قلب کاهش می یابد و باعث افزایش فشار دهلیز راست می شود، نیروی عقبی ناشی از افزایش فشار دهلیزی بر وریدهای گردش خون سیستمیک، بازگشت وریدی خون به قلب را کاهش می دهد. اگر تمام رفلکسهای گردش خون عصبی از عمل کردن جلوگیری شود، با افزایش فشار دهلیز راست تا حدود 7+ میلیمتر جیوه، بازگشت وریدی به صفر میرسد. چنین افزایش جزئی در فشار دهلیز راست باعث کاهش شدید بازگشت وریدی می شود زیرا هر گونه افزایش در فشار برگشتی باعث می شود خون به جای بازگشت به قلب در گردش خون سیستمیک سد شود.
At the same time that the right atrial pressure is rising and causing venous stasis, pumping by the heart also approaches zero because of decreasing venous return. Both the arterial and venous pressures reach equilibrium when all flow in the systemic circulation ceases at a pressure of 7 mm Hg, which, by definition, is the mean systemic filling pressure.
همزمان با افزایش فشار دهلیز راست و ایجاد استاز وریدی، پمپاژ توسط قلب نیز به دلیل کاهش بازگشت وریدی به صفر نزدیک می شود. هر دو فشار شریانی و وریدی زمانی به تعادل می رسند که تمام جریان در گردش خون سیستمیک با فشار 7 میلی متر جیوه متوقف شود، که طبق تعریف، فشار پرشدگی متوسط سیستمی است.

Figure 20-10. Normal venous return curve. The plateau is caused by collapse of the large veins entering the chest when the right atrial pressure falls below atmospheric pressure. Note also that venous return becomes zero when the right atrial pressure rises to equal the mean systemic filling pressure.
شکل 20-10. منحنی بازگشت وریدی طبیعی فلات به دلیل فروپاشی وریدهای بزرگی است که وقتی فشار دهلیز راست به زیر فشار اتمسفر می رسد، وارد قفسه سینه می شوند. همچنین توجه داشته باشید که بازگشت وریدی زمانی صفر می شود که فشار دهلیز راست به برابر فشار متوسط پر شدن سیستمیک افزایش یابد.
Plateau in Venous Return Curve at Negative Atrial Pressures Caused by Collapse of the Large Veins. When the right atrial pressure falls below zero-that is, below atmospheric pressure-any further increase in venous return almost ceases, and by the time the right atrial pressure has fallen to about -2 mm Hg, the venous return reaches a plateau. It remains at this plateau level, even though the right atrial pressure falls to -20 mm Hg, -50 mm Hg or even further. This plateau is caused by collapse of the veins entering the chest. Negative pressure in the right atrium sucks the walls of the veins together where they enter the chest, which prevents any additional flow of blood from the peripheral veins. Consequently, even very negative pressures in the right atrium cannot increase venous return significantly above that which exists at a normal atrial pressure of 0 mm Hg.
فلات در منحنی بازگشت وریدی در فشارهای دهلیزی منفی ناشی از فروپاشی وریدهای بزرگ. وقتی فشار دهلیز راست به زیر صفر میرسد، یعنی زیر فشار اتمسفر، هر گونه افزایش بیشتر در بازگشت وریدی تقریباً متوقف میشود، و زمانی که فشار دهلیز راست به حدود 2- میلیمتر جیوه کاهش یابد، بازگشت وریدی به یک فلات میرسد. در این سطح فلات باقی می ماند، حتی اگر فشار دهلیز راست به 20- میلی متر جیوه، 50- میلی متر جیوه یا حتی بیشتر کاهش یابد. این فلات در اثر فروپاشی وریدهای وارد شده به قفسه سینه ایجاد می شود. فشار منفی در دهلیز راست دیوارههای سیاهرگها را به هم میمکد، جایی که به قفسه سینه وارد میشوند، که از هرگونه جریان اضافی خون از سیاهرگهای محیطی جلوگیری میکند. در نتیجه، حتی فشارهای بسیار منفی در دهلیز راست نمی تواند بازگشت وریدی را به میزان قابل توجهی بالاتر از فشار دهلیزی طبیعی 0 میلی متر جیوه افزایش دهد.
Mean Circulatory Filling Pressure, Mean Systemic Filling Pressure-Effects on Venous Return
When heart pumping is stopped by shocking the heart with electricity to cause ventricular fibrillation or is stopped in any other way, flow of blood everywhere in the circulation ceases a few seconds later. Without blood flow, the pressures everywhere in the circulation become equal. This equilibrated pressure level is called the mean circulatory filling pressure.
میانگین فشار پر کردن گردش خون، فشار پرکننده سیستمیک متوسط - اثرات بر بازگشت وریدی
هنگامی که پمپاژ قلب با شوک الکتریکی به قلب برای ایجاد فیبریلاسیون بطنی متوقف می شود یا به هر طریق دیگری متوقف می شود، جریان خون در همه جای گردش خون چند ثانیه بعد متوقف می شود. بدون جریان خون، فشارها در همه جای گردش خون برابر می شود. این سطح فشار متعادل، فشار پر شدن متوسط گردش خون نامیده می شود.
Increased Blood Volume Raises Mean Circulatory Filling Pressure. The greater the volume of blood in the circulation, the greater is the mean circulatory filling pressure because extra blood volume stretches the walls of the vasculature. The red curve in Figure 20-11 shows the approximate normal effect of different levels of blood volume on the mean circulatory filling pressure. Note that at a blood volume of about 4000 ml, the mean circulatory filling pressure is close to zero because this is the unstressed volume of the circulation but, at a volume of 5000 ml, the filling pressure is the normal value of 7 mm Hg. Similarly, at still higher volumes, the mean circulatory filling pressure increases almost linearly.
افزایش حجم خون میانگین فشار پر شدن گردش خون را افزایش می دهد. هرچه حجم خون در گردش خون بیشتر باشد، فشار متوسط پر شدن گردش خون بیشتر است زیرا حجم خون اضافی دیواره عروق را کشیده میشود. منحنی قرمز در شکل 20-11 اثر طبیعی تقریبی سطوح مختلف حجم خون را بر فشار متوسط پر شدن گردش خون نشان می دهد. توجه داشته باشید که در حجم خون حدود 4000 میلی لیتر، میانگین فشار پر شدن گردش خون نزدیک به صفر است، زیرا این حجم بدون تنش گردش خون است، اما در حجم 5000 میلی لیتر، فشار پر شدن مقدار طبیعی 7 میلی متر جیوه است. به طور مشابه، در حجم های بالاتر، میانگین فشار پر شدن گردش خون تقریباً به صورت خطی افزایش می یابد.
Sympathetic Nervous Stimulation Increases Mean Circulatory Filling Pressure. The green curve and blue curve in Figure 20-11 show the effects, respectively, of high and low levels of sympathetic nervous activity on the mean circulatory filling pressure. Strong sympathetic stimulation constricts all the systemic blood vessels, as well as the larger pulmonary blood vessels and even the chambers of the heart. Therefore, the capacity of the system decreases so that at each level of blood volume, the mean circulatory filling pressure is increased. At normal blood volume, maximal sympathetic stimulation increases the mean circulatory filling pressure from 7 mm Hg to about twice that value or about 14 mm Hg.
تحریک عصبی سمپاتیک فشار متوسط پر شدن گردش خون را افزایش می دهد. منحنی سبز و منحنی آبی در شکل 20-11 به ترتیب اثرات سطوح بالا و پایین فعالیت عصبی سمپاتیک را بر فشار متوسط پر شدن گردش خون نشان می دهند. تحریک شدید سمپاتیک تمام رگ های خونی سیستمیک و همچنین رگ های خونی ریوی بزرگتر و حتی حفره های قلب را منقبض می کند. بنابراین، ظرفیت سیستم کاهش می یابد به طوری که در هر سطح از حجم خون، میانگین فشار پر شدن گردش خون افزایش می یابد. در حجم طبیعی خون، حداکثر تحریک سمپاتیک، میانگین فشار پر شدن گردش خون را از 7 میلی متر جیوه به حدود دو برابر این مقدار یا حدود 14 میلی متر جیوه افزایش می دهد.
Conversely, complete inhibition of the sympathetic nervous system relaxes both the blood vessels and heart, decreasing the mean circulatory filling pressure from the normal value of 7 mm Hg down to about 4 mm Hg. Note in Figure 20-11 how steep the curves are, which means that even slight changes in blood volume or capacity of the system caused by various levels of sympathetic activity can have large effects on the mean circulatory filling pressure.
برعکس، مهار کامل سیستم عصبی سمپاتیک، هم رگهای خونی و هم قلب را شل میکند و میانگین فشار پر شدن گردش خون را از مقدار طبیعی ۷ میلیمتر جیوه به حدود ۴ میلیمتر جیوه کاهش میدهد. در شکل 20-11 توجه داشته باشید که منحنی ها چقدر شیب دار هستند، به این معنی که حتی تغییرات جزئی در حجم خون یا ظرفیت سیستم ناشی از سطوح مختلف فعالیت سمپاتیک می تواند تأثیرات زیادی بر فشار متوسط پر شدن گردش خون داشته باشد.
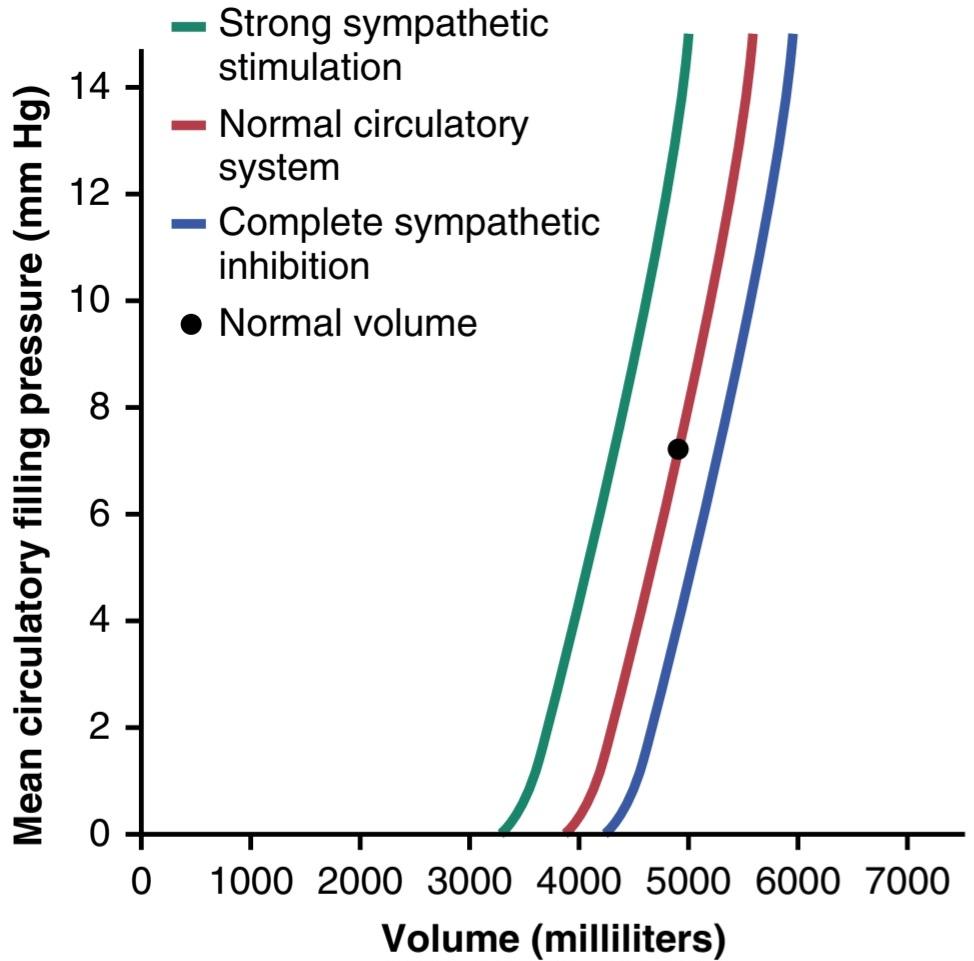
Figure 20-11. Effect of changes in total blood volume on the mean circulatory filling pressure (volume-pressure curve for the entire circulatory system). These curves also show the effects of strong sympathetic stimulation and complete sympathetic inhibition.
شکل 20-11. تأثیر تغییرات حجم کل خون بر میانگین فشار پر شدن گردش خون (منحنی حجم- فشار برای کل سیستم گردش خون). این منحنی ها همچنین اثرات تحریک سمپاتیک قوی و مهار کامل سمپاتیک را نشان می دهند.
Mean Systemic Filling Pressure and Relationship to Mean Circulatory Filling Pressure. The mean systemic filling pressure (Psf) is slightly different from the mean circulatory filling pressure. It is the pressure measured everywhere in the systemic circulation after blood flow has been stopped by clamping the large blood vessels at the heart, so the pressures in the systemic circulation can be measured independently from those in the pulmonary circulation. The mean systemic filling pressure, although almost impossible to measure in a live animal, is almost always nearly equal to the mean circulatory filling pressure, because the pulmonary circulation has less than one-eighth as much capacitance as the systemic circulation and only about one-tenth as much blood volume.
میانگین فشار پر کردن سیستمیک و رابطه با فشار پرکننده متوسط گردش خون. میانگین فشار پر شدن سیستمیک (Psf) کمی با فشار پرشدگی متوسط گردش خون متفاوت است. فشاری است که در همه جای گردش خون سیستمیک پس از قطع جریان خون با بستن رگ های خونی بزرگ در قلب اندازه گیری می شود، بنابراین فشارهای موجود در گردش خون سیستمیک را می توان مستقل از فشارهای موجود در گردش خون ریوی اندازه گیری کرد. میانگین فشار پرشدگی سیستمیک، اگرچه تقریباً غیرممکن است اندازهگیری در یک حیوان زنده انجام شود، اما تقریباً همیشه تقریباً برابر با میانگین فشار پر شدن گردش خون است، زیرا گردش خون ریوی کمتر از یک هشتم ظرفیت گردش خون سیستمیک و تنها حدود یک دهم حجم خون دارد.
Effect on Venous Return Curve of Changes in Mean Systemic Filling Pressure. Figure 20-12 shows the effects on the venous return curve caused by increasing or decreasing Psf. Note that the normal Psf is about 7 mm Hg. Then, for the uppermost curve in the figure, Psf has been increased to 14 mm Hg and, for the lowermost curve, it has decreased to 3.5 mm Hg. These curves demonstrate that the higher the Psf (which also means the greater the “tightness” with which the circulatory system is filled with blood), the more the venous return curve shifts upward and to the right. Conversely, the lower the Psf, the more the curve shifts downward and to the left.
تأثیر منحنی بازگشت وریدی تغییرات در فشار پرشدگی سیستمیک متوسط. شکل 20-12 اثرات منحنی بازگشت وریدی ناشی از افزایش یا کاهش Psf را نشان می دهد. توجه داشته باشید که Psf طبیعی حدود 7 میلی متر جیوه است. سپس برای بالاترین منحنی شکل، Psf به 14 میلی متر جیوه و برای پایین ترین منحنی به 3.5 میلی متر جیوه کاهش یافته است. این منحنیها نشان میدهند که هر چه Psf بالاتر باشد (که همچنین به معنای «سفتی» بیشتر است که سیستم گردش خون با آن پر شده است)، منحنی بازگشت وریدی بیشتر به سمت بالا و به راست جابهجا میشود. برعکس، هر چه Psf کمتر باشد، منحنی بیشتر به سمت پایین و به چپ تغییر می کند.
Expressing this another way, the greater the degree to which the system is filled, the easier it is for blood to flow into the heart. The lesser the degree to which the system is filled, the more difficult it is for blood to flow into the heart.
با بیان دیگر، هر چه میزان پر شدن سیستم بیشتر باشد، خون راحتتر به قلب میرود. هر چه میزان پر شدن سیستم کمتر باشد، جریان خون به قلب دشوارتر می شود.
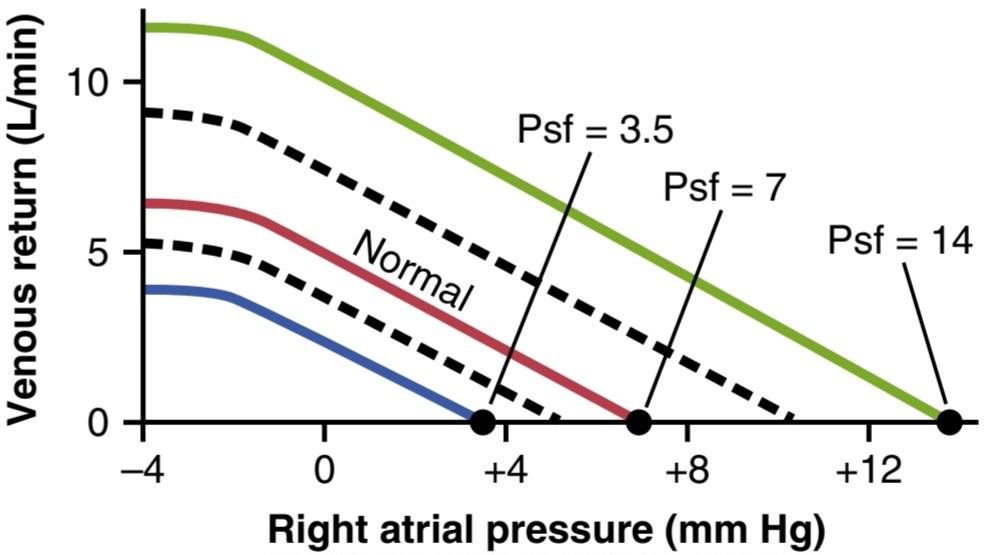
Figure 20-12. Venous return curves showing the normal curve when the mean systemic filling pressure (Psf) is 7 mm Hg and the effect of altering the Psf to 3.5, 7, or 14 mm Hg. (Modified from Guyton AC, Jones CE, Coleman TG: Circulatory Physiology: Cardiac Output and Its Regulation, 2nd ed. Philadelphia: WB Saunders, 1973.)
شکل 20-12. منحنیهای بازگشت وریدی که منحنی نرمال را در زمانی که میانگین فشار پر شدن سیستمیک (Psf) 7 میلیمتر جیوه است و اثر تغییر Psf را به 3.5، 7 یا 14 میلیمتر جیوه نشان میدهد. (اصلاح شده از Guyton AC, Jones CE, Coleman TG: Circulation Physiology: Cardiac Output and Itsregulation, ed. 2nd. Philadelphia: WB Saunders, 1973.)
When Pressure Gradient for Venous Return Is Zero There Is No Venous Return. When the right atrial pres- sure rises to equal the Psf, there is no longer any pres- sure difference between the peripheral vessels and right atrium. Consequently, there can no longer be any blood flow from peripheral vessels back to the right atrium. However, when the right atrial pressure falls progressively lower than the Psf, blood flow to the heart increases proportionately, as can be seen by studying any of the venous return curves in Figure 20-12. That is, the greater the difference between the Psf and right atrial pressure, the greater becomes the venous return. Therefore, the difference between these two pressures is called the pressure gradient for venous return.
وقتی گرادیان فشار برای بازگشت وریدی صفر است، بازگشت وریدی وجود ندارد. هنگامی که فشار دهلیز راست به برابر Psf افزایش یابد، دیگر هیچ تفاوت فشاری بین عروق محیطی و دهلیز راست وجود ندارد. در نتیجه، دیگر هیچ جریان خونی از عروق محیطی به دهلیز راست وجود ندارد. با این حال، هنگامی که فشار دهلیز راست به طور تدریجی کمتر از Psf می شود، جریان خون به قلب به طور متناسب افزایش می یابد، همانطور که با مطالعه هر یک از منحنی های بازگشت وریدی در شکل 20-12 قابل مشاهده است. یعنی هر چه اختلاف فشار دهلیز راست و Psf بیشتر باشد بازگشت وریدی بیشتر می شود. بنابراین، تفاوت بین این دو فشار، گرادیان فشار برای بازگشت وریدی نامیده می شود.
Resistance to Venous Return
In the same way that Psf represents a pressure pushing venous blood from the periphery toward the heart, there is also resistance to this venous flow of blood. This is called the resistance to venous return. Most of the resistance to venous return occurs in the veins, although some occurs in the arterioles and small arteries as well.
مقاومت در برابر بازگشت وریدی
همانطور که Psf فشاری را نشان می دهد که خون وریدی را از محیط به سمت قلب می راند، در برابر این جریان وریدی خون نیز مقاومت وجود دارد. این مقاومت در برابر بازگشت وریدی نامیده می شود. بیشتر مقاومت در برابر بازگشت وریدی در وریدها رخ می دهد، اگرچه مقداری در شریان ها و شریان های کوچک نیز رخ می دهد.
Why is venous resistance so important in determining the resistance to venous return? The answer is that when the resistance in the veins increases, blood begins to be dammed up, mainly in the veins themselves. However, the venous pressure rises very little because the veins are highly distensible. Therefore, this rise in venous pressure is not very effective in overcoming the resistance, and blood flow into the right atrium decreases drastically. Conversely, when arteriolar and small artery resistances increase, blood accumulates in the arteries, which have a capacitance only one thirtieth as great as that of the veins. Therefore, even slight accumulation of blood in the arteries raises the pressure greatly-30 times as much as in the veins-and this high pressure overcomes much of the increased resistance. Mathematically, it turns out that about two-thirds of the so-called resistance to venous return is determined by venous resistance, and about one-third is determined by the arteriolar and small artery resistance.
چرا مقاومت وریدی در تعیین مقاومت در برابر بازگشت وریدی بسیار مهم است؟ پاسخ این است که وقتی مقاومت در وریدها افزایش مییابد، خون به طور عمده در خود سیاهرگها شروع به کوبیدن میکند. با این حال، فشار وریدی بسیار کم افزایش می یابد، زیرا سیاهرگ ها بسیار قابل انبساط هستند. بنابراین این افزایش فشار وریدی در غلبه بر مقاومت چندان موثر نیست و جریان خون به دهلیز راست به شدت کاهش می یابد. برعکس، زمانی که مقاومت شریانها و شریانهای کوچک افزایش مییابد، خون در شریانها تجمع مییابد که ظرفیت آنها تنها یک سی ام بزرگتر از ظرفیت سیاهرگها است. بنابراین، حتی تجمع اندک خون در شریانها فشار را تا حد زیادی 30 برابر بیشتر از وریدها افزایش میدهد و این فشار بالا بر مقاومت افزایش یافته غلبه میکند. از نظر ریاضی، معلوم می شود که حدود دو سوم مقاومت به اصطلاح در برابر بازگشت وریدی توسط مقاومت وریدی و حدود یک سوم توسط مقاومت شریان و شریان کوچک تعیین می شود.
Venous return can be calculated by the following formula:
بازگشت وریدی را می توان با فرمول زیر محاسبه کرد:
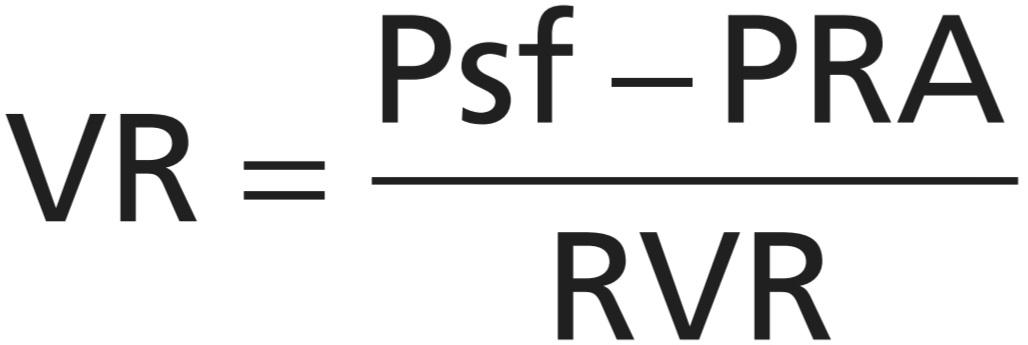
in which VR is venous return, Psf is mean systemic filling pressure, PRA is right atrial pressure, and RVR is resistance to venous return. In the healthy adult, the approximate values for these are as follows: venous return = 5 L/min, Psf = 7 mm Hg, right atrial pressure = 0 mm Hg, and resistance to venous return = 1.4 mm Hg/L/min of blood flow.
که در آن VR بازگشت وریدی است، Psf میانگین فشار پر شدن سیستمیک، PRA فشار دهلیز راست و RVR مقاومت در برابر بازگشت وریدی است. در بزرگسالان سالم، مقادیر تقریبی این موارد به شرح زیر است: بازگشت وریدی = 5 لیتر در دقیقه، Psf = 7 میلی متر جیوه، فشار دهلیز راست = 0 میلی متر جیوه، و مقاومت در برابر بازگشت وریدی = 1.4 میلی متر جیوه در لیتر در دقیقه جریان خون.
Effect of Resistance to Venous Return on the Venous Return Curve. Figure 20-13 demonstrates the effect of different levels of resistance to venous return on the venous return curve, showing that a decrease in this resistance to half-normal allows twice as much flow of blood and, therefore, rotates the curve upward to twice as great a slope. Conversely, an increase in resistance to twice normal rotates the curve downward to half as great a slope.
تأثیر مقاومت در برابر بازگشت وریدی بر منحنی بازگشت وریدی. شکل 20-13 اثر سطوح مختلف مقاومت در برابر بازگشت وریدی را بر روی منحنی بازگشت وریدی نشان میدهد و نشان میدهد که کاهش این مقاومت تا نیمه نرمال اجازه دو برابر جریان خون را میدهد و بنابراین، منحنی را به سمت بالا میچرخاند تا شیب دو برابر بیشتر شود. برعکس، افزایش مقاومت تا دو برابر نرمال، منحنی را به سمت پایین تا نصف شیب بزرگ می چرخاند.
Note also that when the right atrial pressure rises to equal the Psf, venous return becomes zero at all levels of resistance to venous return because there is no pressure gradient to cause flow of blood. Therefore, the highest level to which the right atrial pressure can rise, regardless of how much the heart might fail, is equal to the Psf.
همچنین توجه داشته باشید که وقتی فشار دهلیز راست به برابر Psf افزایش مییابد، بازگشت وریدی در تمام سطوح مقاومت در برابر بازگشت وریدی صفر میشود، زیرا شیب فشاری وجود ندارد که باعث جریان خون شود. بنابراین، بالاترین سطحی که فشار دهلیز راست می تواند افزایش یابد، صرف نظر از میزان نارسایی قلب، برابر با Psf است.
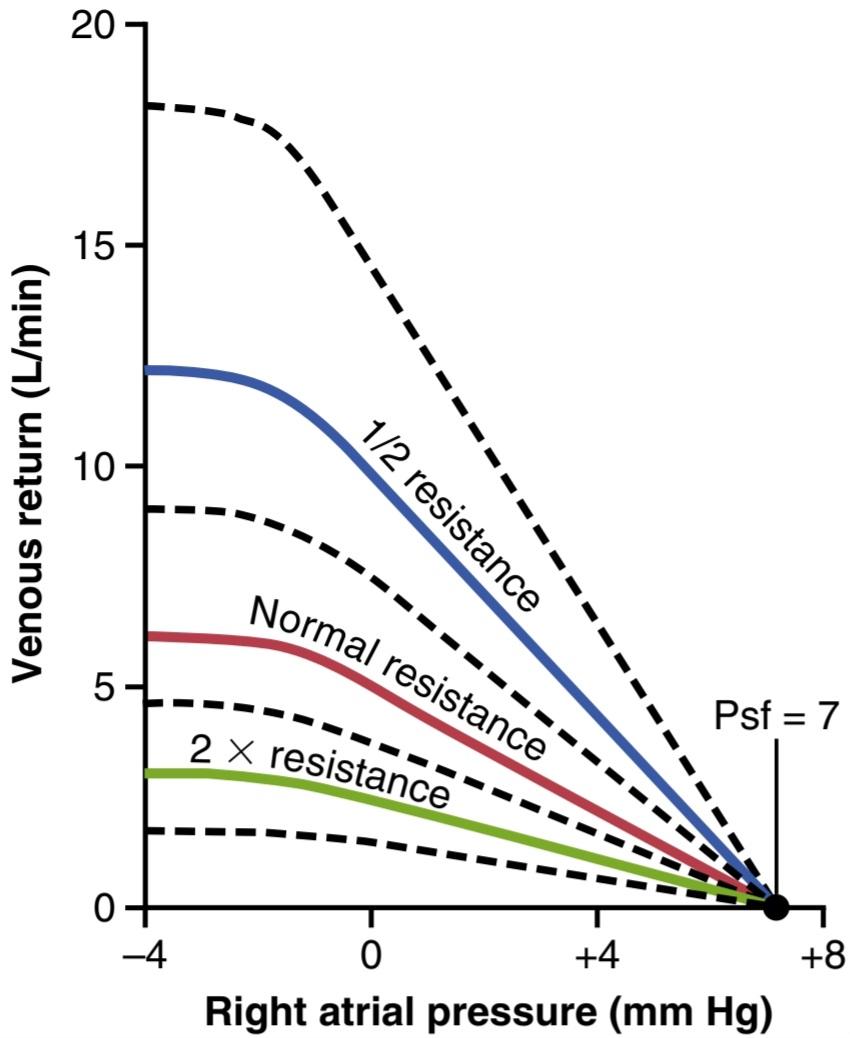
Figure 20-13. Venous return curves depicting the effect of altering the resistance to venous return. Psf, Mean systemic filling pressure. (Modified from Guyton AC, Jones CE, Coleman TG: Circulatory Physi- ology: Cardiac Output and Its Regulation, 2nd ed. Philadelphia: WB Saunders, 1973.)
شکل 20-13. منحنی های بازگشت وریدی که اثر تغییر مقاومت در برابر بازگشت وریدی را نشان می دهد. Psf، میانگین فشار پر شدن سیستمیک. (اصلاح شده از Guyton AC, Jones CE, Coleman TG: Circulation Physi-ology: Cardiac Output and It Regulation, ed. 2nd. Philadelphia: WB Saunders, 1973.)
Combinations of Venous Return Curve Patterns. Figure 20-14 shows the effects on the venous return curve caused by simultaneous changes in Psf and resistance to venous return, demonstrating that both these factors can operate simultaneously.
ترکیبی از الگوهای منحنی بازگشت وریدی. شکل 20-14 اثرات روی منحنی بازگشت وریدی ناشی از تغییرات همزمان در Psf و مقاومت در برابر بازگشت وریدی را نشان میدهد، که نشان میدهد هر دوی این عوامل میتوانند به طور همزمان عمل کنند.
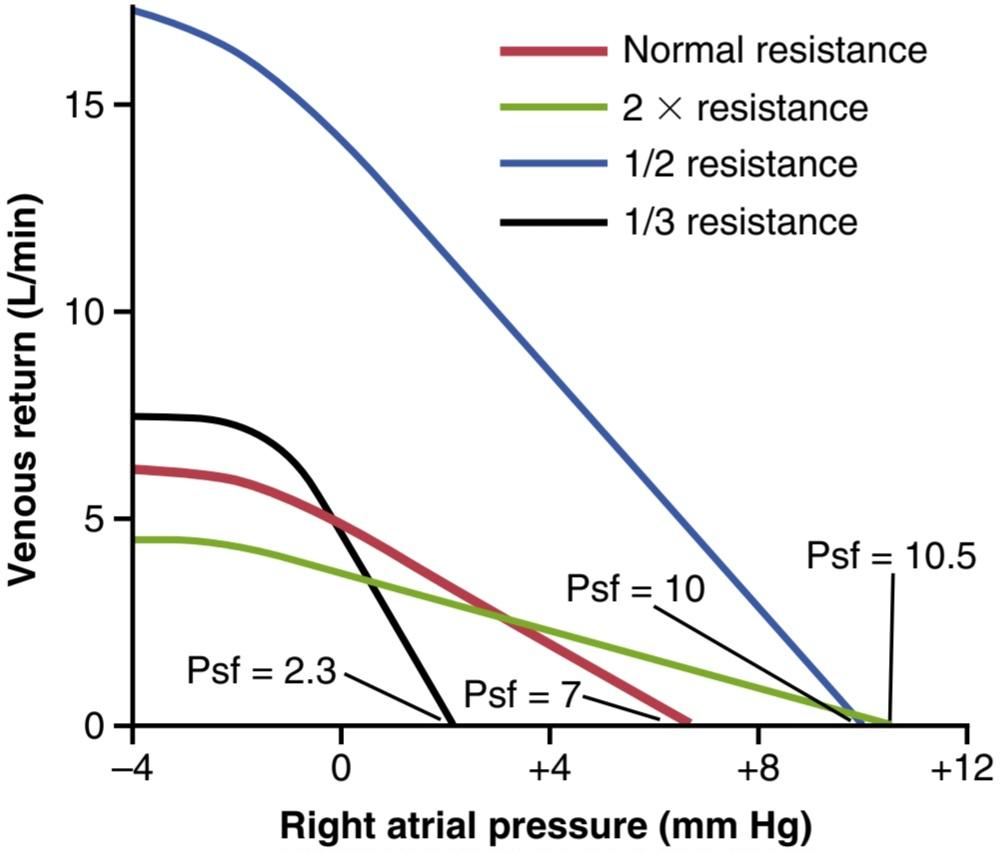
Figure 20-14. Combinations of the major patterns of venous return curves showing the effects of simultaneous changes in the mean sys- temic filling pressure (Psf) and in resistance to venous return. (Modi- fied from Guyton AC, Jones CE, Coleman TG: Circulatory Physiology: Cardiac Output and Its Regulation, 2nd ed. Philadelphia: WB Saun- ders, 1973.)
شکل 20-14. ترکیبی از الگوهای اصلی منحنی های بازگشت وریدی که اثرات تغییرات همزمان در فشار پرشدگی متوسط سیستم (Psf) و مقاومت در برابر بازگشت وریدی را نشان می دهد. (اصلاح شده از Guyton AC, Jones CE, Coleman TG: Circulation Physiology: Cardiac Output and It, Edit 2nd. Philadelphia: WB Saunders, 1973.)
ANALYSIS OF CARDIAC OUTPUT AND RIGHT ATRIAL PRESSURE BY SIMULTANEOUS CARDIAC OUTPUT AND VENOUS RETURN CURVES
In the complete circulation, the heart and the systemic circulation must operate together. This requirement means that (1) the venous return from the systemic circulation must equal the cardiac output from the heart and (2) the right atrial pressure is the same for the heart and systemic circulation.
تجزیه و تحلیل برون ده قلبی و فشار دهلیز راست با برون ده قلبی و منحنی های بازگشت وریدی همزمان
در گردش کامل، قلب و گردش خون سیستمیک باید با هم کار کنند. این نیاز به این معنی است که (1) بازگشت وریدی از گردش خون سیستمیک باید برابر با برون ده قلبی از قلب باشد و (2) فشار دهلیز راست برای قلب و گردش خون سیستمیک یکسان است.
Therefore, one can predict the cardiac output and right atrial pressure in the following way:
بنابراین، می توان برون ده قلبی و فشار دهلیز راست را به روش زیر پیش بینی کرد:
1. Determine the momentary pumping ability of the heart, and depict this ability in the form of a cardiac output curve.
2. Determine the momentary state of flow from the systemic circulation into the heart, and depict this state of flow in the form of a venous return curve.
3. Equate these curves against each other, as shown in Figure 20-15.
1. توانایی پمپاژ لحظه ای قلب را تعیین کنید و این توانایی را به صورت منحنی برون ده قلبی به تصویر بکشید.
2. وضعیت لحظه ای جریان از گردش خون سیستمیک به قلب را تعیین کنید و این حالت جریان را به شکل منحنی بازگشت وریدی به تصویر بکشید.
3. همانطور که در شکل 20-15 نشان داده شده است، این منحنی ها را با یکدیگر برابر کنید.
Two curves in the figure depict the normal cardiac out- put curve (red line) and the normal venous return curve (blue line). There is only one point on the graph, point A, at which the venous return equals the cardiac output and at which the right atrial pressure is the same for both the heart and systemic circulation. Therefore, in the normal circulation, the right atrial pressure, cardiac output, and venous return are all depicted by point A, called the equilibrium point, giving a normal value for cardiac output of 5 L/min and a right atrial pressure of 0 mm Hg.
دو منحنی در شکل منحنی برون ده قلبی طبیعی (خط قرمز) و منحنی بازگشت وریدی طبیعی (خط آبی) را نشان می دهند. تنها یک نقطه در نمودار وجود دارد، نقطه A، که در آن بازگشت وریدی برابر با برون ده قلبی است و در آن فشار دهلیز راست هم برای قلب و هم برای گردش خون سیستمیک یکسان است. بنابراین، در گردش خون طبیعی، فشار دهلیزی راست، برون ده قلبی و بازگشت وریدی همه با نقطه A نشان داده میشوند که نقطه تعادل نامیده میشود و مقدار طبیعی برای برون ده قلبی 5 لیتر در دقیقه و فشار دهلیزی راست 0 میلیمتر جیوه است.

Figure 20-15. The two solid curves demonstrate an analysis of cardiac output and right atrial pressure when the cardiac output (red line) and venous return (blue line) curves are normal. Transfusion of blood equal to 20% of the blood volume causes the venous return curve to become the dashed curve. As a result, the cardiac output and right atrial pressure shift from point A to point B. Psf, Mean systemic filling pressure.
شکل 20-15. دو منحنی جامد تجزیه و تحلیل برون ده قلبی و فشار دهلیز راست را هنگامی که منحنی های برون ده قلبی (خط قرمز) و بازگشت وریدی (خط آبی) نرمال هستند نشان می دهند. انتقال خون معادل 20 درصد حجم خون باعث می شود که منحنی بازگشت وریدی به منحنی شکسته تبدیل شود. در نتیجه، برون ده قلبی و فشار دهلیز راست از نقطه A به نقطه B تغییر می کند. Psf، میانگین فشار پر شدن سیستمیک.
Effect of Increased Blood Volume on Cardiac Output. A sudden increase in blood volume of about 20% increases the cardiac output to about 2.5 to 3 times normal. An analysis of this effect is shown in Figure 20-15. Immediately on infusing the large quantity of extra blood, the increased filling of the system causes the Psf to increase to 16 mm Hg, which shifts the venous return curve to the right. At the same time, the increased blood volume distends the blood vessels, reducing their resistance and thereby reducing the resistance to venous return, which rotates the curve upward. As a result of these two effects, the venous return curve of Figure 20-15 is shifted to the right. This new curve equates with the cardiac output curve at point B, showing that the cardiac output and venous return increase 2.5 to 3 times and that the right atrial pressure rises to about +8 mm Hg.
تأثیر افزایش حجم خون بر برون ده قلبی. افزایش ناگهانی حجم خون حدود 20 درصد، برون ده قلبی را تا حدود 2.5 تا 3 برابر طبیعی افزایش می دهد. تجزیه و تحلیل این اثر در شکل 20-15 نشان داده شده است. بلافاصله پس از تزریق مقدار زیادی خون اضافی، افزایش پر شدن سیستم باعث می شود Psf به 16 میلی متر جیوه افزایش یابد که منحنی بازگشت وریدی را به سمت راست تغییر می دهد. در عین حال، افزایش حجم خون رگهای خونی را متسع میکند و مقاومت آنها را کاهش میدهد و در نتیجه مقاومت در برابر بازگشت وریدی را کاهش میدهد که منحنی را به سمت بالا میچرخاند. در نتیجه این دو اثر، منحنی بازگشت وریدی شکل 20-15 به سمت راست منتقل می شود. این منحنی جدید با منحنی برون ده قلبی در نقطه B برابر است و نشان می دهد که برون ده قلبی و بازگشت وریدی 2.5 تا 3 برابر افزایش می یابد و فشار دهلیز راست تا حدود 8+ میلی متر جیوه افزایش می یابد.
Compensatory Effects Initiated in Response to Increased Blood Volume. The greatly increased cardiac output caused by increased blood volume lasts for only a few minutes because several compensatory effects immediately begin to occur:
اثرات جبرانی در پاسخ به افزایش حجم خون آغاز شد. افزایش بسیار برون ده قلبی ناشی از افزایش حجم خون تنها چند دقیقه طول می کشد زیرا چندین اثر جبرانی بلافاصله شروع می شود:
1. The increased cardiac output increases the capillary pressure so that fluid begins to transude out of the capillaries into the tissues, thereby returning the blood volume toward normal.
1. افزایش برون ده قلبی فشار مویرگی را افزایش می دهد به طوری که مایع شروع به ترانسود از مویرگ ها به داخل بافت ها می کند و در نتیجه حجم خون را به حالت عادی برمی گرداند.
2. The increased pressure in the veins causes the veins to continue distending gradually by the mechanism called stress-relaxation, especially causing the venous blood reservoirs, such as the liver and spleen, to distend, thus reducing the Psf.
2. افزایش فشار در وریدها باعث میشود که رگها به تدریج با مکانیسمی به نام تنشآرامش به متسع شدن ادامه دهند، بهویژه که باعث انبساط مخازن خون وریدی مانند کبد و طحال میشود و در نتیجه باعث کاهش Psf میشود.
3. The excess blood flow through the peripheral tissues causes an autoregulatory increase in the peripheral vascular resistance, thus increasing the resistance to venous return.
3. جریان خون اضافی از طریق بافت های محیطی باعث افزایش خودتنظیمی در مقاومت عروق محیطی می شود و در نتیجه مقاومت در برابر بازگشت وریدی افزایش می یابد.
These factors cause the Psf to return toward normal and the resistance vessels of the systemic circulation to constrict. Therefore, gradually, over a period of 10 to 40 minutes, the cardiac output returns almost to normal.
این عوامل باعث می شوند که Psf به حالت عادی برگردد و رگ های مقاومتی گردش خون سیستمیک منقبض شوند. بنابراین، به تدریج و در یک دوره 10 تا 40 دقیقه ای، برون ده قلبی تقریباً به حالت عادی باز می گردد.
Effect of Sympathetic Stimulation on Cardiac Output. Sympathetic stimulation affects the heart and systemic circulation: (1) it makes the heart a stronger pump; and (2) in the systemic circulation, it increases the Psf because of contraction of the peripheral vessels, especially the veins, and it increases the resistance to venous return.
تأثیر تحریک سمپاتیک بر برون ده قلبی. تحریک سمپاتیک بر قلب و گردش خون سیستمیک تأثیر می گذارد: (1) قلب را پمپ قوی تری می سازد. و (2) در گردش خون سیستمیک، Psf را به دلیل انقباض عروق محیطی، به ویژه وریدها، افزایش می دهد و مقاومت در برابر بازگشت وریدی را افزایش می دهد.
In Figure 20-16, the normal cardiac output and venous return curves are depicted; these equate with each other at point A, which represents a normal venous return, cardiac output of 5 L/min. and right atrial pressure of 0 mm Hg. Note in the figure that maximal sympathetic stimulation (green curves) increases the Psf to 17 mm Hg (depicted by the point at which the venous return curve reaches the zero venous return level). Sympathetic stimulation also increases pumping effectiveness of the heart by nearly 100%. As a result, the cardiac output rises from the normal value at equilibrium point A to about double normal at equilibrium point D, and yet the right atrial pressure hardly changes. Thus, different degrees of sympathetic stimulation can increase the cardiac output progressively to about twice normal for short periods, until other compensatory effects occur within seconds or minutes to return cardiac output to nearly normal.
در شکل 20-16، منحنی های برون ده قلبی و بازگشت وریدی طبیعی نشان داده شده است. اینها در نقطه A با یکدیگر برابر می شوند، که نشان دهنده بازگشت وریدی طبیعی، برون ده قلبی 5 لیتر در دقیقه است. و فشار دهلیز راست 0 میلی متر جیوه. در شکل توجه داشته باشید که حداکثر تحریک سمپاتیک (منحنی های سبز) Psf را تا 17 میلی متر جیوه افزایش می دهد (که با نقطه ای که منحنی بازگشت وریدی به سطح بازگشت وریدی صفر می رسد نشان داده می شود). تحریک سمپاتیک همچنین اثربخشی پمپاژ قلب را نزدیک به 100٪ افزایش می دهد. در نتیجه، برون ده قلب از مقدار طبیعی در نقطه تعادل A به حدود دو برابر نرمال در نقطه تعادل D افزایش می یابد و با این حال فشار دهلیز راست به سختی تغییر می کند. بنابراین، درجات مختلف تحریک سمپاتیک می تواند برون ده قلبی را به طور پیش رونده به حدود دو برابر نرمال برای دوره های کوتاه افزایش دهد، تا زمانی که سایر اثرات جبرانی در عرض چند ثانیه یا چند دقیقه رخ دهد تا برون ده قلبی به تقریباً نرمال برگردد.
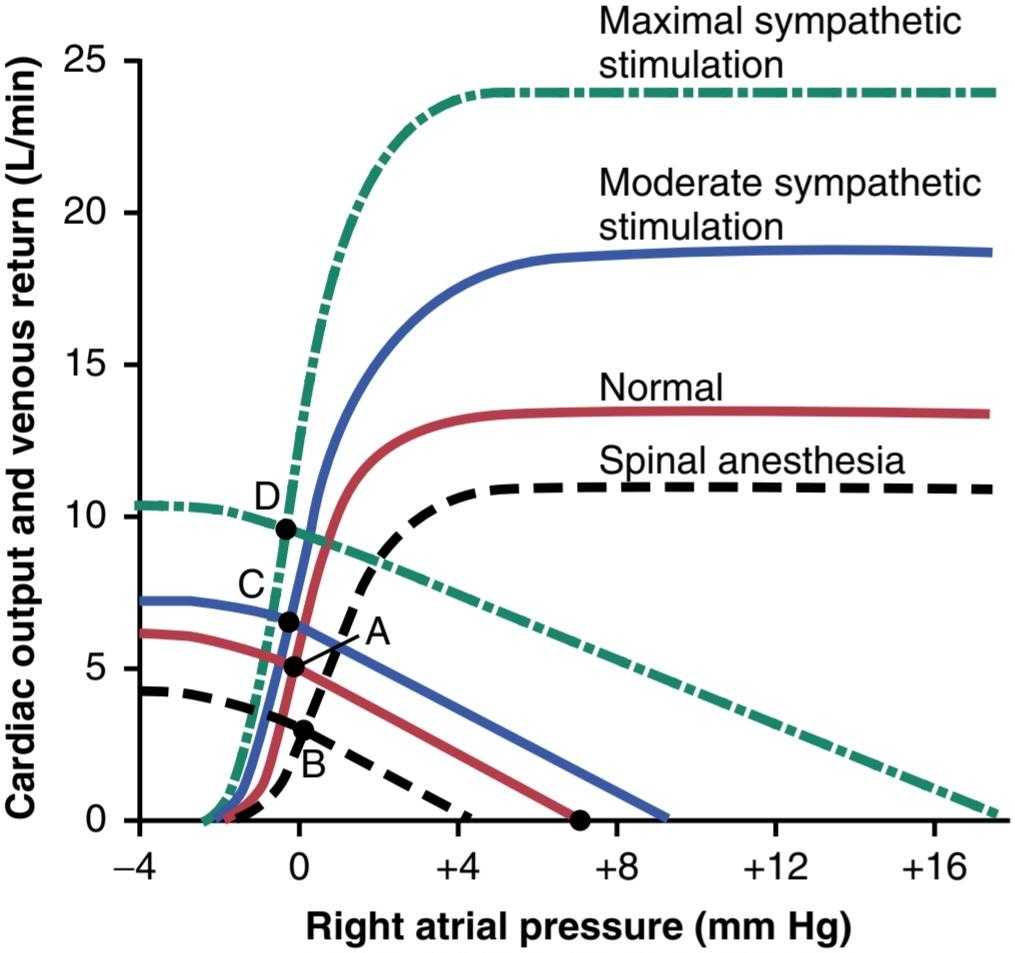
Figure 20-16. Analysis of the effect on cardiac output of (1) moderate sympathetic stimulation (from point A to point C), (2) maximal sympathetic stimulation (point D), and (3) sympathetic inhibition caused by total spinal anesthesia (point B). (Modified from Guyton AC, Jones CE, Coleman TG: Circulatory Physiology: Cardiac Output and Its Regulation, 2nd ed. Philadelphia: WB Saunders, 1973.)
شکل 20-16. تجزیه و تحلیل اثر بر برون ده قلبی (1) تحریک سمپاتیک متوسط (از نقطه A تا نقطه C)، (2) حداکثر تحریک سمپاتیک (نقطه D) و (3) مهار سمپاتیک ناشی از بی حسی کامل نخاعی (نقطه B). (اصلاح شده از Guyton AC, Jones CE, Coleman TG: Circulation Physiology: Cardiac Output and Itsregulation, ed. 2nd. Philadelphia: WB Saunders, 1973.)
Effect of Sympathetic Inhibition on Cardiac Output. The sympathetic nervous system can be blocked by inducing total spinal anesthesia or by using a drug, such as hexamethonium, that blocks transmission of nerve signals through the autonomic ganglia. The lowermost curves in Figure 20-16 show the effect of sympathetic inhibition caused by total spinal anesthesia, demonstrating the fol- lowing: (1) the Psf falls to about 4 mm Hg; and (2) the effectiveness of the heart as a pump decreases to about 80% of normal. The cardiac output falls from point A to point B, which is a decrease to about 60% of normal.
اثر مهار سمپاتیک بر برون ده قلبی. سیستم عصبی سمپاتیک را می توان با القای بی حسی کامل نخاعی یا با استفاده از دارویی مانند هگزامتونیوم که انتقال سیگنال های عصبی را از طریق عقده های اتونوم مسدود می کند مسدود کرد. پایین ترین منحنی ها در شکل 20-16 اثر مهار سمپاتیک ناشی از بی حسی نخاعی کامل را نشان می دهد و موارد زیر را نشان می دهد: (1) Psf به حدود 4 میلی متر جیوه می رسد. و (2) اثربخشی قلب به عنوان یک پمپ به حدود 80٪ از حد طبیعی کاهش می یابد. برون ده قلبی از نقطه A به نقطه B کاهش می یابد که تا حدود 60 درصد کاهش طبیعی است.
Effect of Opening a Large Arteriovenous Fistula. Figure 20-17 shows various stages of circulatory changes that occur after opening a large AV fistula—that is, after making an opening directly between a large artery and a large vein.
تاثیر باز کردن فیستول شریانی وریدی بزرگ. شکل 20-17 مراحل مختلفی از تغییرات گردش خون را نشان می دهد که پس از باز کردن یک فیستول AV بزرگ رخ می دهد – یعنی پس از ایجاد شکافی مستقیم بین یک شریان بزرگ و یک ورید بزرگ.
1. The two red curves crossing at point A show the normal condition.
1. دو منحنی قرمز که در نقطه A از هم عبور می کنند، وضعیت عادی را نشان می دهند.
2. The curves crossing at point B show the circulatory condition immediately after opening the large fistula.The principal effects are as follows: (a) a sudden and precipitous rotation of the venous return curve up- ward caused by the large decrease in resistance to venous return when blood is allowed to flow with almost no impediment directly from the large arteries into the venous system, bypassing most of the resistance elements of the peripheral circulation; and (b) a slight increase in the level of the cardiac output curve because opening the fistula decreases the peripheral resistance and allows an acute fall in arterial pressure against which the heart can pump more easily. The net result, depicted by point B, is an increase in cardiac output from 5 L/min up to 13 L/min and an increase in right atrial pressure to about +3 mm Hg.
2. عبور منحنی ها در نقطه B وضعیت گردش خون را بلافاصله پس از باز کردن فیستول بزرگ نشان می دهد. اثرات اصلی به شرح زیر است: (الف) چرخش ناگهانی و سریع منحنی بازگشت وریدی به سمت بالا ناشی از کاهش زیاد مقاومت در برابر بازگشت وریدی هنگامی که خون اجازه میدهد تقریباً بدون هیچ مانعی مستقیماً از سیستم شریانی بزرگ به سمت مقاومت جریان یابد. گردش محیطی؛ و (ب) افزایش جزئی در سطح منحنی برون ده قلبی، زیرا باز کردن فیستول، مقاومت محیطی را کاهش میدهد و امکان کاهش شدید فشار شریانی را فراهم میکند که قلب میتواند راحتتر در برابر آن پمپاژ کند. نتیجه خالص، که با نقطه B نشان داده شده است، افزایش برون ده قلبی از 5 لیتر در دقیقه به 13 لیتر در دقیقه و افزایش فشار دهلیز راست به حدود 3+ میلی متر جیوه است.
3. Point C represents the effects about 1 minute later, after the sympathetic nerve reflexes have restored the arterial pressure almost to normal and caused two other effects: (a) an increase in the Psf (because of constriction of all veins and arteries) from 7 to 9 mm Hg, thus shifting the venous return curve 2 mm Hg to the right; and (b) further elevation of the cardiac output curve because of sympathetic nervous excitation of the heart. The cardiac output now rises to almost 16 L/min, and the right atrial pres- sure rises to about 4 mm Hg.
3. نقطه C نشان دهنده اثرات حدود 1 دقیقه بعد است، پس از اینکه رفلکس های عصبی سمپاتیک فشار شریانی را تقریباً به حالت عادی بازگرداند و دو اثر دیگر ایجاد کرد: (الف) افزایش Psf (به دلیل انقباض همه سیاهرگ ها و شریان ها) از 7 به 9 میلی متر جیوه، در نتیجه منحنی بازگشت وریدی mmg به سمت راست تغییر می کند. و (ب) افزایش بیشتر منحنی برون ده قلبی به دلیل تحریک عصبی سمپاتیک قلب. برون ده قلب در حال حاضر تقریبا به 16 لیتر در دقیقه و فشار دهلیز راست به حدود 4 میلی متر جیوه افزایش می یابد.
4. Point D shows the effect after several more weeks. By this time, the blood volume has increased be- cause the slight reduction in arterial pressure and the sympathetic stimulation have both transiently reduced the kidney output of urine, causing salt and water retention. The Psf has now risen to +12 mm Hg, shifting the venous return curve another 3 mm Hg to the right. Also, the prolonged increased workload on the heart has caused the heart muscle to hypertrophy slightly, raising the level of the cardiac output curve still further. Therefore, point D shows a cardiac output that is now almost 20 L/min and a right atrial pressure of about 6 mm Hg.
4. نقطه D اثر را پس از چند هفته دیگر نشان می دهد. در این زمان، حجم خون افزایش یافته است زیرا کاهش جزئی فشار شریانی و تحریک سمپاتیک هر دو به طور موقت برون ده ادرار را از کلیه کاهش داده و باعث احتباس نمک و آب می شود. Psf اکنون به 12+ میلیمتر جیوه افزایش یافته است و منحنی بازگشت وریدی را 3 میلیمتر جیوه دیگر به سمت راست تغییر میدهد. همچنین، افزایش طولانیمدت بار کار بر روی قلب باعث شده است که عضله قلب کمی هیپرتروفی شود و سطح منحنی برون ده قلبی را بیشتر افزایش دهد. بنابراین، نقطه D برون ده قلبی را نشان می دهد که اکنون تقریباً 20 لیتر در دقیقه و فشار دهلیز راست حدود 6 میلی متر جیوه است.
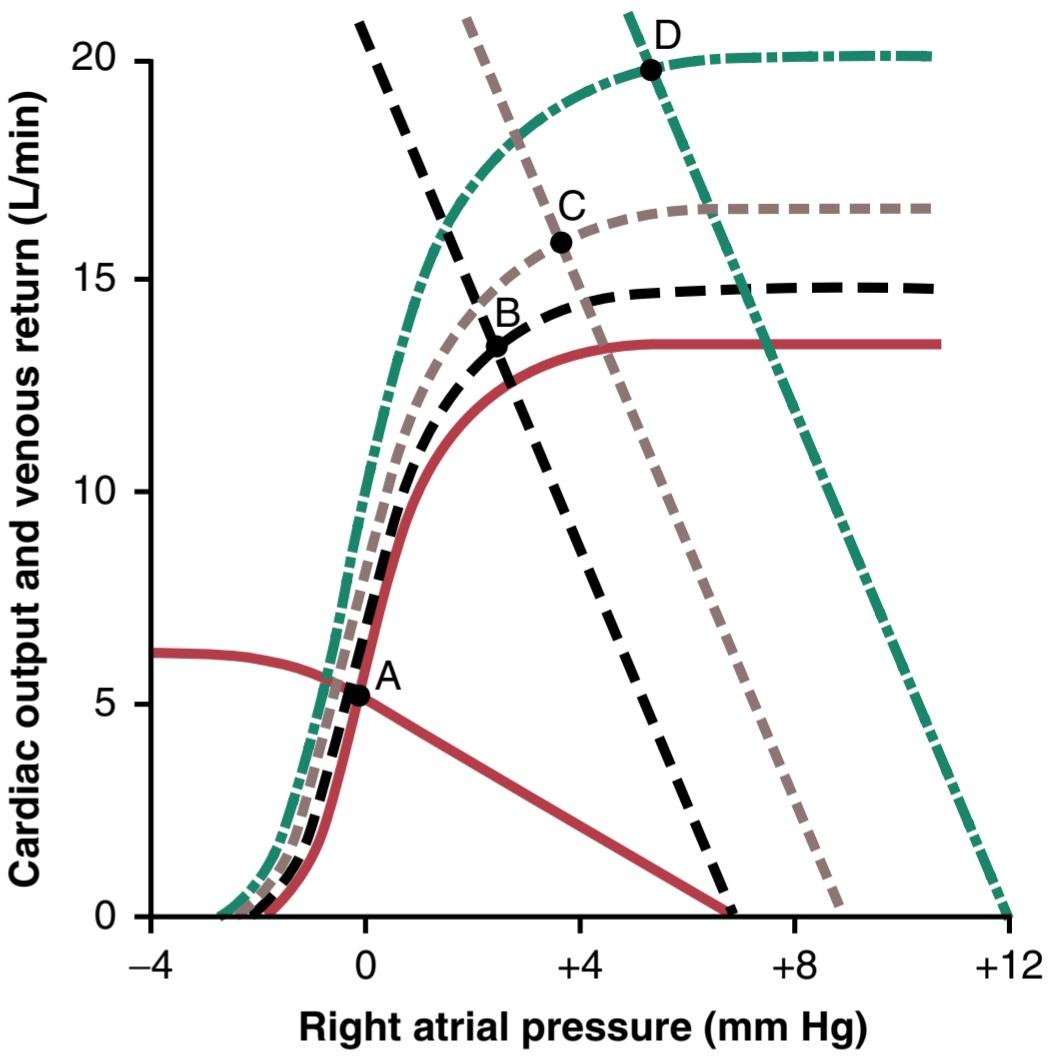
Figure 20-17. Analysis of successive changes in cardiac output and right atrial pressure in a human after a large arteriovenous (AV) fistula is suddenly opened. The stages of the analysis, as shown by the equilibrium points, are as follows: A, normal conditions; B, immedi- ately after opening the AV fistula; C, 1 minute or so after the sympathetic reflexes have become active; and D, several weeks after the blood volume has increased and the heart has begun to hypertrophy. (Modified from Guyton AC, Jones CE, Coleman TG: Circulatory Physiology: Cardiac Output and Its Regulation, 2nd ed. Philadelphia: WB Saunders, 1973.)
شکل 20-17. تجزیه و تحلیل تغییرات پی در پی در برون ده قلبی و فشار دهلیز راست در انسان پس از باز شدن ناگهانی فیستول شریانی وریدی بزرگ (AV). مراحل تجزیه و تحلیل، همانطور که توسط نقاط تعادل نشان داده شده است، به شرح زیر است: الف، شرایط عادی. B، بلافاصله پس از باز کردن فیستول AV. C، 1 دقیقه یا بیشتر پس از فعال شدن رفلکس های سمپاتیک. و D، چندین هفته پس از افزایش حجم خون و شروع هیپرتروفی قلب. (اصلاح شده از Guyton AC, Jones CE, Coleman TG: Circulation Physi-ology: Cardiac Output and It Regulation, ed. 2nd. Philadelphia: WB Saunders, 1973.)
Other Analyses of Cardiac Output Regulation. In Chapter 21, analysis of cardiac output regulation during exercise is presented. In Chapter 22, analyses of cardiac output regulation at various stages of congestive heart failure are discussed.
سایر آنالیزهای تنظیم برون ده قلبی. در فصل 21، تجزیه و تحلیل تنظیم برون ده قلبی در حین ورزش ارائه شده است. در فصل 22، تجزیه و تحلیل تنظیم برون ده قلبی در مراحل مختلف نارسایی احتقانی قلب مورد بحث قرار گرفته است.
METHODS FOR MEASURING CARDIAC OUTPUT
Accurate assessment of cardiac output is vitally important in modern medical practice, especially in critically ill patients or in high-risk patients undergoing surgery. In animal experiments, one can measure the cardiac output using an electromagnetic or ultrasonic flowmeter placed on the aorta or pulmonary artery to measure cardiac output. In humans, however, cardiac output is usually measured by indirect methods that do not require surgery.
روش های اندازه گیری برون ده قلبی
ارزیابی دقیق برون ده قلبی در عمل پزشکی مدرن، به ویژه در بیماران بدحال یا در بیماران پرخطر تحت عمل جراحی بسیار مهم است. در آزمایشهای حیوانی، میتوان برون ده قلبی را با استفاده از فلومتر الکترومغناطیسی یا اولتراسونیک که روی آئورت یا شریان ریوی برای اندازهگیری برون ده قلبی قرار میگیرد، اندازهگیری کرد. با این حال، در انسان، برون ده قلبی معمولاً با روش های غیرمستقیم که نیازی به جراحی ندارند، اندازه گیری می شود.
Pulsatile Output of the Heart Measured by Electromagnetic or Ultrasonic Flowmeter
Figure 20-18 shows a recording in a dog of blood flow in the root of the aorta; this recording was made using an electromagnetic flowmeter. It demonstrates that the blood flow rises rapidly to a peak during systole and then, at the end of systole, it reverses for a fraction of a second. This reverse flow causes the aortic valve to close and the flow to return to zero.
خروجی ضربانی قلب با اندازه گیری جریان سنج الکترومغناطیسی یا اولتراسونیک
شکل 20-18 یک ضبط در سگی از جریان خون در ریشه آئورت را نشان می دهد. این ضبط با استفاده از فلومتر الکترومغناطیسی انجام شده است. این نشان می دهد که جریان خون در طول سیستول به سرعت به اوج می رسد و سپس در پایان سیستول، برای کسری از ثانیه معکوس می شود. این جریان معکوس باعث بسته شدن دریچه آئورت و بازگشت جریان به صفر می شود.
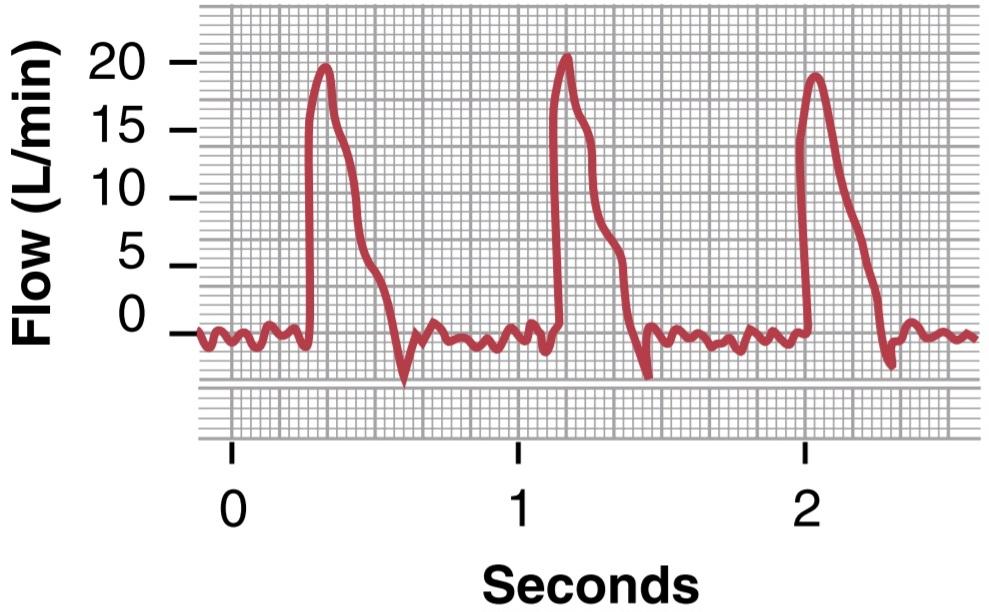
Figure 20-18. Pulsatile blood flow in the root of the aorta recorded using an electromagnetic flowmeter.
شکل 20-18. جریان خون ضربانی در ریشه آئورت با استفاده از جریان سنج الکترومغناطیسی ثبت شد.
Measurement of Cardiac Output Using the Oxygen Fick Principle
The Fick principle is explained by Figure 20-19. This figure shows that 200 ml of oxygen are being absorbed from the lungs into the pulmonary blood each minute. It also shows that the blood entering the right heart has an oxygen concentration of 160 ml/L of blood, whereas that leaving the left heart has an oxygen concentration of 200 ml/L of blood. From these data, one can calculate that each liter of blood passing through the lungs absorbs 40 ml of oxygen.
اندازه گیری برون ده قلبی با استفاده از اصل فیک اکسیژن
اصل فیک در شکل 20-19 توضیح داده شده است. این شکل نشان می دهد که در هر دقیقه 200 میلی لیتر اکسیژن از ریه ها به خون ریوی جذب می شود. همچنین نشان می دهد که خون ورودی به قلب راست دارای غلظت اکسیژن 160 میلی لیتر در لیتر خون است، در حالی که خون خروجی از قلب چپ دارای غلظت اکسیژن 200 میلی لیتر در لیتر خون است. از این داده ها می توان محاسبه کرد که هر لیتر خونی که از ریه ها عبور می کند، 40 میلی لیتر اکسیژن جذب می کند.
Because the total quantity of oxygen absorbed into the blood from the lungs each minute is 200 ml, dividing 200 by 40 calculates to a total of 5 liters of blood that must pass through the pulmonary circulation each minute to absorb this amount of oxygen. Therefore, the quantity of blood flowing through the lungs each minute is 5 liters, which is also a measure of the cardiac output. Thus, the cardiac output can be calculated by the following formula:
از آنجایی که مقدار کل اکسیژن جذب شده به خون از ریه ها در هر دقیقه 200 میلی لیتر است، با تقسیم 200 بر 40 به مجموع 5 لیتر خون در هر دقیقه محاسبه می شود که برای جذب این مقدار اکسیژن باید در هر دقیقه از گردش خون ریوی عبور کند. بنابراین، مقدار خونی که در هر دقیقه از ریه ها می گذرد 5 لیتر است که این مقدار نیز معیاری برای برون ده قلبی است. بنابراین، برون ده قلبی را می توان با فرمول زیر محاسبه کرد:

In applying this Fick procedure for measuring cardiac output in humans, mixed venous blood is usually obtained through a catheter inserted up the brachial vein of the forearm, through the subclavian vein, down to the right atrium and, finally, into the right ventricle or pulmonary artery. Systemic arterial blood can then be obtained from any systemic artery in the body. The rate of oxygen absorption by the lungs is measured by the rate of disappearance of oxygen from the respired air, using any type of oxygen meter.
در استفاده از این روش فیک برای اندازهگیری برون ده قلبی در انسان، خون وریدی مختلط معمولاً از طریق یک کاتتر وارد شده در ورید بازویی ساعد، از طریق ورید ساب کلاوین، تا دهلیز راست و در نهایت، به بطن راست یا شریان ریوی به دست میآید. سپس خون شریانی سیستمیک را می توان از هر شریان سیستمیک در بدن دریافت کرد. میزان جذب اکسیژن توسط ریه ها با سرعت ناپدید شدن اکسیژن از هوای تنفسی با استفاده از هر نوع اکسیژن سنج اندازه گیری می شود.
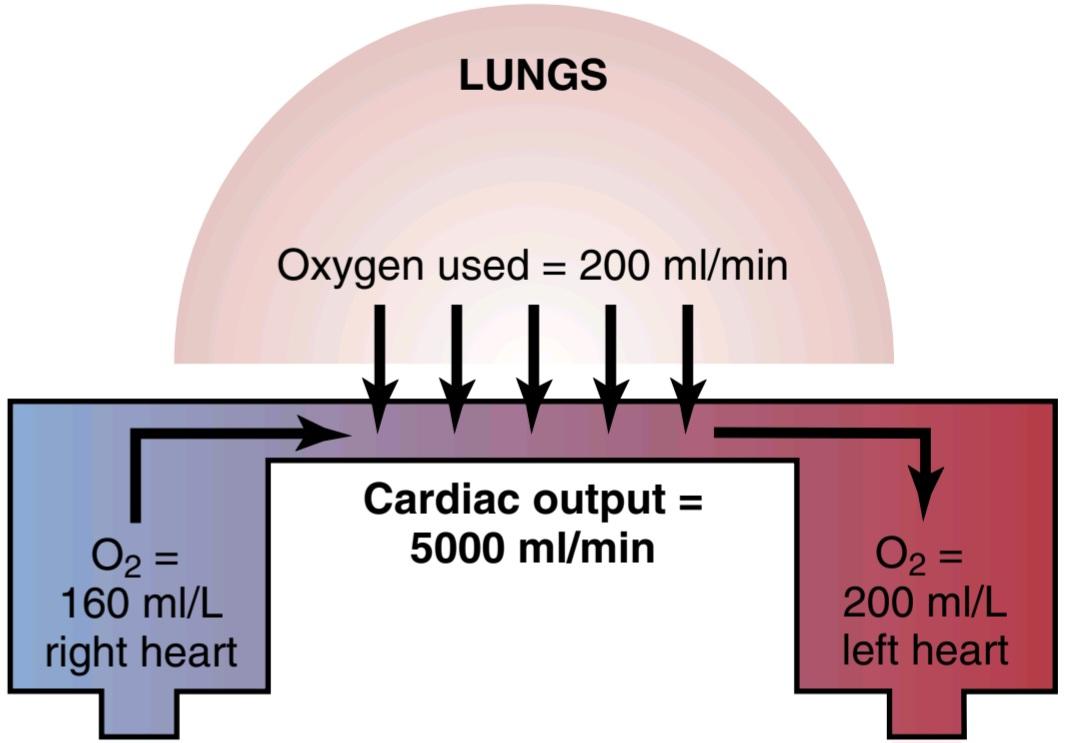
Figure 20-19. Fick principle for determining cardiac output.
شکل 20-19. اصل فیک برای تعیین برون ده قلبی
Indicator Dilution Method
To measure cardiac output by the indicator dilution method, a small amount of indicator, such as a dye, is injected into a large systemic vein or, preferably, into the right atrium. This indicator passes rapidly through the right side of the heart, then through the blood vessels of the lungs, through the left side of the heart, and finally into the systemic arterial system. The concentration of the dye is recorded as the dye passes through one of the peripheral arteries, giving a curve as shown in Figure 20-20. In each of these cases, 5 milligrams of Cardiogreen dye were injected at zero time. In the top recording, none of the dye passed into the arterial tree until about 3 seconds after the injection, but then the arterial concentration of the dye rose rapidly to a maximum in about 6 to 7 seconds. After that, the concentration fell rapidly, but before the concentration reached zero, some of the dye had already circulated all the way through some of the peripheral systemic vessels and returned through the heart for a second time. Consequently, the dye concentration in the artery began to rise again. For the purpose of calculation, it is necessary to extrapolate the early downslope of the curve to the zero point, as shown by the dashed portion of each curve. In this way, the extrapolated time-concentration curve of the dye in the systemic artery without recirculation can be measured in its first portion and estimated reasonably accurately in its latter portion.
روش رقیق سازی اندیکاتور
برای اندازه گیری برون ده قلبی با روش رقیق سازی اندیکاتور، مقدار کمی از شاخص، مانند رنگ، به یک ورید سیستمیک بزرگ یا ترجیحاً به دهلیز راست تزریق می شود. این نشانگر به سرعت از سمت راست قلب، سپس از طریق عروق خونی ریه ها، از سمت چپ قلب و در نهایت به سیستم شریانی سیستمیک عبور می کند. غلظت رنگ هنگام عبور رنگ از یکی از شریان های محیطی ثبت می شود و منحنی مانند شکل 20-20 نشان داده می شود. در هر یک از این موارد 5 میلی گرم رنگ کاردیوگرین در زمان صفر تزریق شد. در ضبط بالا، تا حدود 3 ثانیه پس از تزریق، هیچ یک از رنگ به درخت شریانی نرسید، اما سپس غلظت شریانی رنگ به سرعت در حدود 6 تا 7 ثانیه به حداکثر رسید. پس از آن، غلظت به سرعت کاهش یافت، اما قبل از اینکه غلظت به صفر برسد، مقداری از رنگ قبلاً در تمام مسیر در برخی از عروق سیستمیک محیطی گردش کرده بود و برای بار دوم از طریق قلب بازگشته بود. در نتیجه، غلظت رنگ در شریان دوباره شروع به افزایش کرد. برای محاسبه، لازم است که شیب اولیه منحنی را به نقطه صفر برون یابی کنیم، همانطور که توسط قسمت چین خورده هر منحنی نشان داده شده است. به این ترتیب، منحنی تمرکز زمان برون یابی رنگ در شریان سیستمیک بدون گردش مجدد را می توان در قسمت اول آن اندازه گیری کرد و در قسمت آخر آن را با دقت منطقی تخمین زد.
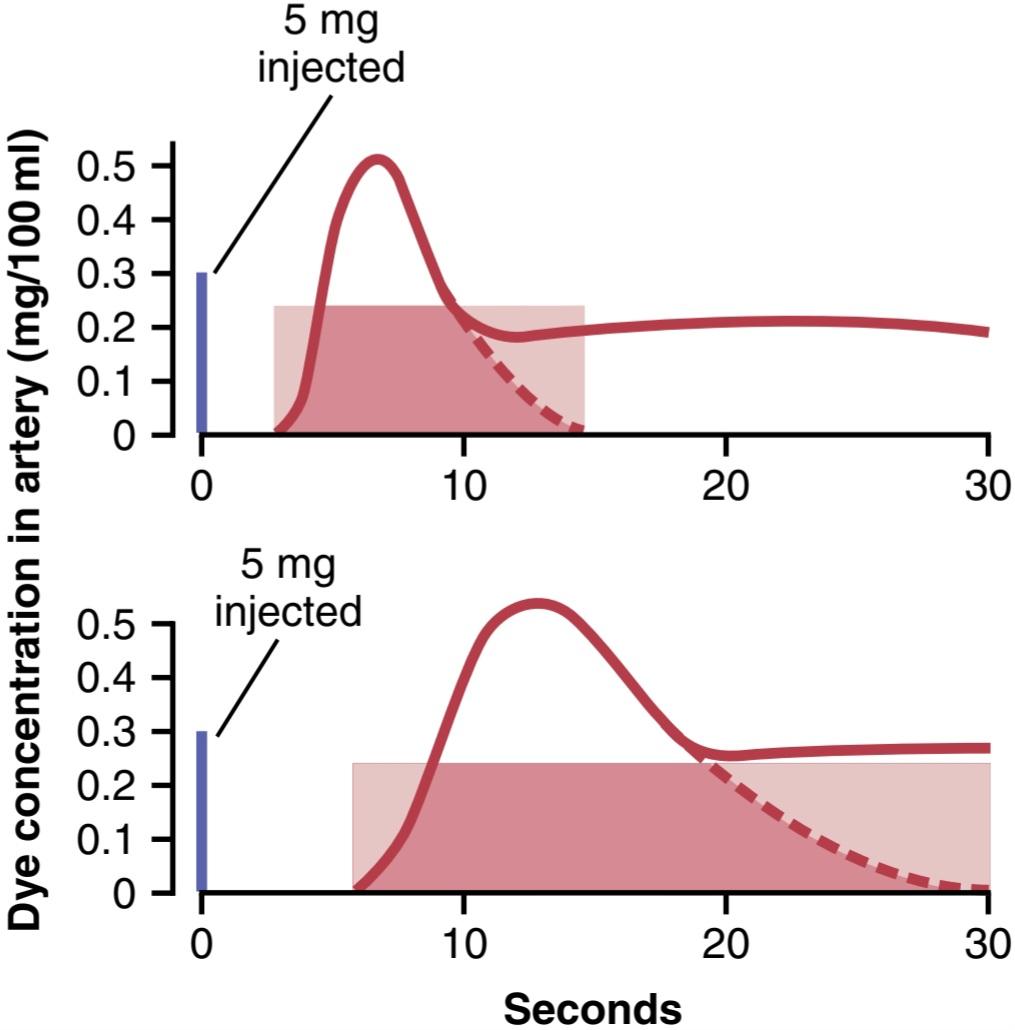
Figure 20-20. Extrapolated dye concentration curves used to calculate two separate cardiac outputs by the dilution method. The rectangular areas are the calculated average concentrations of dye in the arterial blood for the durations of the respective extrapolated curves.
شکل 20-20. منحنی های غلظت رنگ برون یابی شده برای محاسبه دو برون ده قلبی جداگانه با روش رقیق سازی استفاده می شود. نواحی مستطیلی، میانگین محاسبه شده غلظت رنگ در خون شریانی برای مدت زمان منحنی های برون یابی مربوطه است.
Once the extrapolated time-concentration curve has been determined, the mean concentration of dye in the arterial blood for the duration of the curve can then be calculated. For example, in the top example of Figure 20-20, this calculation was done by measuring the area under the entire initial and extrapolated curve and then averaging the concentration of dye for the duration of the curve. One can see from the shaded rectangle straddling the curve in the upper figure that the average concentration of dye was 0.25 mg/dl of blood and that the duration of this average value was 12 seconds. A total of 5 milligrams of dye had been injected at the beginning of the experiment. For blood carrying only 0.25 milligram of dye in each 100 milliliters to carry the entire 5 milligrams of dye through the heart and lungs in 12 seconds, a total of 20 portions, each with 100 milliliters of blood, would have passed through the heart during the 12 seconds, which would be the same as a cardiac output of 2 L/12 sec, or 10 L/min. We leave it to the reader to calculate the cardiac output from the bottom extrapolated curve of Figure 20-20. To summarize, the cardiac output can be determined using the following formula:
پس از تعیین منحنی زمان-غلظت برون یابی، می توان میانگین غلظت رنگ در خون شریانی برای مدت زمان منحنی را محاسبه کرد. به عنوان مثال، در مثال بالای شکل 20-20، این محاسبه با اندازه گیری سطح زیر کل منحنی اولیه و برون یابی شده و سپس میانگین غلظت رنگ برای مدت منحنی انجام شده است. می توان از مستطیل سایه دار منحنی شکل بالا مشاهده کرد که میانگین غلظت رنگ 0.25 میلی گرم در دسی لیتر خون و مدت زمان این مقدار متوسط 12 ثانیه بود. در ابتدای آزمایش در مجموع 5 میلی گرم رنگ تزریق شده بود. برای خونی که تنها 0.25 میلی گرم رنگ در هر 100 میلی لیتر حمل می کند تا کل 5 میلی گرم رنگ را در 12 ثانیه از قلب و ریه ها عبور دهد، در مجموع 20 قسمت، هر کدام با 100 میلی لیتر خون، در طول 12 ثانیه از قلب عبور می کند، که برابر با 12 ثانیه یا 10 لیتر خروجی a2 است. L/min محاسبه برون ده قلبی را از منحنی برون یابی پایین شکل 20-20 به خواننده واگذار می کنیم. به طور خلاصه، برون ده قلبی را می توان با استفاده از فرمول زیر تعیین کرد:
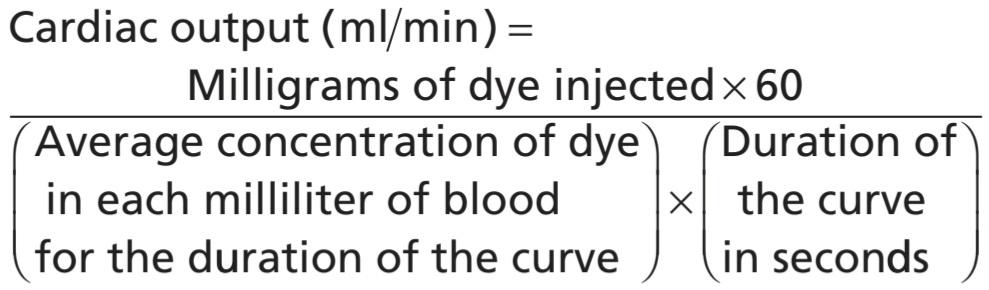
Echocardiography
Cardiac output can also be estimated by echocardiography, a method that uses ultrasound waves from a transducer placed on the chest wall or passed into the patient’s esophagus to measure the size of the heart’s chambers and the velocity of blood flowing from the left ventricle into the aorta. Stroke volume is calculated from the velocity of blood flowing into the aorta, and the aorta cross-sectional area is determined from the aorta diameter measured by ultrasound imaging. Cardiac output is then calculated from the product of the stroke volume and heart rate.
اکوکاردیوگرافی
برون ده قلب را می توان با اکوکاردیوگرافی تخمین زد، روشی که از امواج اولتراسوند از یک مبدل قرار داده شده بر روی دیواره قفسه سینه یا عبور از مری بیمار برای اندازه گیری اندازه حفره های قلب و سرعت جریان خون از بطن چپ به آئورت استفاده می کند. حجم ضربه از سرعت جریان خون به داخل آئورت محاسبه می شود و سطح مقطع آئورت از قطر آئورت اندازه گیری شده توسط تصویربرداری اولتراسوند تعیین می شود. سپس برون ده قلبی از حاصل ضرب حجم ضربه و ضربان قلب محاسبه می شود.
Thoracic Electrical Bioimpedance Method
Impedance cardiography, also known as thoracic electrical bioimpedance, is a noninvasive technology used to measure changes in total electrical conductivity of the thorax as an indirect assessment of hemodynamic parameters such as cardiac output. This method detects the impedance changes caused by a high-frequency, low- magnitude current flowing through the thorax between additional two pairs of electrodes located outside the measured segment. Electrical impedance is the opposition that a circuit presents to a current when a voltage is applied. With each heartbeat, blood volume and velocity in the aorta change, and the corresponding change in impedance and its timing are measured and used to estimate cardiac output.
روش بیومپدانس الکتریکی قفسه سینه
کاردیوگرافی امپدانس که به عنوان بیوامپدانس الکتریکی قفسه سینه نیز شناخته می شود، یک فناوری غیرتهاجمی است که برای اندازه گیری تغییرات هدایت الکتریکی کل قفسه سینه به عنوان ارزیابی غیرمستقیم پارامترهای همودینامیک مانند برون ده قلبی استفاده می شود. این روش تغییرات امپدانس ناشی از جریان با فرکانس بالا و قدر کم را که از طریق قفسه سینه بین دو جفت الکترود اضافی واقع در خارج از بخش اندازهگیری شده میگذرد، تشخیص میدهد. امپدانس الکتریکی تضادی است که یک مدار در هنگام اعمال ولتاژ به جریان نشان می دهد. با هر ضربان قلب، حجم و سرعت خون در آئورت تغییر می کند، و تغییر مربوطه در امپدانس و زمان آن اندازه گیری می شود و برای تخمین برون ده قلبی استفاده می شود.
Although some studies have suggested that impedance cardiography may provide reasonable assessments of cardiac output under some conditions, this method is also subject to several potential sources of error, including electrical interferences, motion artifacts, fluid accumulation around the heart and in the lungs, and arrhythmias. Some studies have suggested that the average error with this method may be as high as 20% to 40%.
اگرچه برخی از مطالعات نشان دادهاند که کاردیوگرافی امپدانس ممکن است ارزیابیهای معقولی از برون ده قلبی را تحت برخی شرایط ارائه دهد، این روش همچنین در معرض چندین منبع خطا از جمله تداخل الکتریکی، آرتیفکتهای حرکتی، تجمع مایع در اطراف قلب و ریهها و آریتمی است. برخی مطالعات نشان داده اند که میانگین خطای این روش ممکن است بین 20 تا 40 درصد باشد.
Accurate assessment of cardiac output provides insight into heart function and tissue perfusion because cardiac output represents the sum of blood flows to all the organs and tissues of the body. Thus, noninvasive methods for more accurate measurements of cardiac output are continuously being developed for managing patients with circulatory distress.
ارزیابی دقیق برون ده قلبی بینشی را در مورد عملکرد قلب و پرفیوژن بافت فراهم می کند زیرا برون ده قلبی مجموع جریان خون به تمام اندام ها و بافت های بدن را نشان می دهد. بنابراین، روشهای غیرتهاجمی برای اندازهگیری دقیقتر برون ده قلبی به طور مداوم برای مدیریت بیماران مبتلا به دیسترس گردش خون در حال توسعه هستند.
کلیک کنید «Bibliography: فهرست کتب مربوطه»
Berger D, Takala J: Determinants of systemic venous return and the impact of positive pressure ventilation. Ann Transl Med 6:350, 2018.
Guyton AC: Determination of cardiac output by equating venous re- turn curves with cardiac response curves. Physiol Rev 35:123, 1955.
Guyton AC: The relationship of cardiac output and arterial pressure control. Circulation 64:1079, 1981.
Guyton AC, Jones CE, Coleman TG: Circulatory Physiology: Cardiac Output and Its Regulation. Philadelphia: WB Saunders, 1973.
Hall JE: Integration and regulation of cardiovascular function. Am J Physiol 277:5174, 1999.
Hall JE: The pioneering use of systems analysis to study cardiac output regulation. Am J Physiol Regul Integr Comp Physiol 287:R1009, 2004.
Klein I, Danzi S: Thyroid disease and the heart. Circulation 116:1725, 2007.
Kobe J, Mishra N, Arya VK, Al-Moustadi W, Nates W, Kumar B: Cardiac output monitoring: technology and choice. Ann Card Anaesth 22:6, 2019.
Magder S: Volume and its relationship to cardiac output and venous return. Crit Care 20:271, 2016.
Patterson SW, Starling EH: On the mechanical factors which deter- mine the output of the ventricles. J Physiol 48:357, 1914.
Rothe CF: Reflex control of veins and vascular capacitance. Physiol Rev 63:1281, 1983.
Rothe CF: Mean circulatory filling pressure: its meaning and measurement. J Appl Physiol 74:499, 1993.
Sarnoff SJ, Berglund E: Ventricular function. 1. Starling’s law of the heart, studied by means of simultaneous right and left ventricular function curves in the dog. Circulation 9:706, 1953.
Thiele RH, Bartels K, Gan TJ: Cardiac output monitoring: a contemporary assessment and review. Crit Care Med 43:177, 2015.
Uemura K, Sugimachi M, Kawada T, et al: A novel framework of circulatory equilibrium. Am J Physiol Heart Circ Physiol 286:H2376, 2004.
🚀 با ما همراه شوید!
تازهترین مطالب و آموزشهای مغز و اعصاب را از دست ندهید. با فالو کردن کانال تلگرام آیندهنگاران مغز، از ما حمایت کنید!