
مبانی علوم اعصاب اریک کندل؛ ماهیت ساختاری پردازش بینایی؛ قشر بینایی


دعای مطالعه [ نمایش ]
بِسْمِ الله الرَّحْمنِ الرَّحیمِ
اَللّهُمَّ اَخْرِجْنى مِنْ ظُلُماتِ الْوَهْمِ
خدايا مرا بيرون آور از تاريكىهاى وهم،
وَ اَكْرِمْنى بِنُورِ الْفَهْمِ
و به نور فهم گرامى ام بدار،
اَللّهُمَّ افْتَحْ عَلَيْنا اَبْوابَ رَحْمَتِكَ
خدايا درهاى رحمتت را به روى ما بگشا،
وَانْشُرْ عَلَيْنا خَزائِنَ عُلُومِكَ بِرَحْمَتِكَ يا اَرْحَمَ الرّاحِمينَ
و خزانههاى علومت را بر ما باز كن به امید رحمتت اى مهربانترين مهربانان.
«مبانی علوم اعصاب» اثر دکتر اریک کندل و همکاران، یکی از جامعترین و معتبرترین منابع در حوزه علوم اعصاب محسوب میشود.
ترجمه دقیق این کتاب، با مدیریت داریوش طاهری و تحت نظارت برند علمی آیندهنگاران مغز، با الهام از تلاشهای علمی و تدریس اساتیدی همچون دکتر محمدتقی جغتایی و دکتر ثریا مهرابی، به فارسی برگردانده شده است.
این ترجمه، دسترسی به دانش عمیق علوم اعصاب را برای دانشجویان و پژوهشگران رشتههای پزشکی، علوم اعصاب، روانشناسی، علوم شناختی، هوش مصنوعی، گفتاردرمانی، مهندسی پزشکی و تمام علاقهمندان به درک عملکرد ذهن و مغز فراهم کرده و گامی در راستای ارتقای دانش و بهبود کیفیت زندگی است.
» کتاب مبانی علوم اعصاب اریک کندل
» » فصل ۲۱: فصل ماهیت ساختاری پردازش بینایی؛ قسمت سوم
در حال ویرایش
Principles of Neural Science; Eric R. Kandel
»» Chapter 21: Sensory Coding
The Constructive Nature of Visual Processing
ماهیت سازنده پردازش بصری
Visual Perception Is a Constructive Process
ادراک بصری یک فرآیند سازنده است
Visual Processing Is Mediated by the Geniculostriate Pathway
پردازش بصری توسط مسیر ژنیکولواستریات انجام میشود
Form, Color, Motion, and Depth Are Processed in Discrete Areas of the Cerebral Cortex
فرم، رنگ، حرکت و عمق در نواحی مجزایی از قشر مغز پردازش میشوند
The Receptive Fields of Neurons at Successive Relays in the Visual Pathway Provide Clues to How the Brain Analyzes Visual Form
میدانهای گیرنده نورونها در رلههای متوالی در مسیر بینایی، سرنخهایی از نحوه تجزیه و تحلیل فرم بصری توسط مغز ارائه میدهند
The Visual Cortex Is Organized Into Columns of Specialized Neurons
قشر بینایی به صورت ستونهایی از نورونهای تخصصی سازماندهی شده است
Intrinsic Cortical Circuits Transform Neural Information
مدارهای قشری ذاتی، اطلاعات عصبی را تبدیل میکنند
Visual Information Is Represented by a Variety of Neural Codes
اطلاعات بصری توسط انواع کدهای عصبی نمایش داده میشود
Highlights
نکات برجسته
The Visual Cortex Is Organized Into Columns of Specialized Neurons
قشر بینایی به صورت ستونهایی از نورونهای تخصصی سازماندهی شده است
The dominant feature of the functional organization of the primary visual cortex is the visuotopic organization of its cells: the visual field is systematically represented across the surface of the cortex (Figure 21-11A).
ویژگی غالب سازمان عملکردی قشر بینایی اولیه، سازمان ویزوتوپیک سلولهای آن است: میدان بینایی به طور سیستماتیک در سراسر سطح قشر نمایش داده میشود (شکل 21-11A).
In addition, cells in the primary visual cortex with similar functional properties are located close together in columns that extend from the surface of the cortex to the white matter. The columns are concerned with the functional properties that are analyzed in any given cortical area and thus reflect the functional role of that area in vision. The properties that are developed in the primary visual cortex include orientation specificity and the integration of inputs from the two eyes, which is measured as the relative strength of input from each eye, or ocular dominance.
علاوه بر این، سلولهای قشر بینایی اولیه با ویژگیهای عملکردی مشابه، در ستونهایی که از سطح قشر تا ماده سفید امتداد دارند، نزدیک به هم قرار گرفتهاند. این ستونها مربوط به ویژگیهای عملکردی هستند که در هر ناحیه قشری مشخص تجزیه و تحلیل میشوند و بنابراین نقش عملکردی آن ناحیه را در بینایی منعکس میکنند. ویژگیهایی که در قشر بینایی اولیه ایجاد میشوند شامل ویژگی جهتگیری و ادغام ورودیها از دو چشم است که به عنوان قدرت نسبی ورودی از هر چشم یا غلبه چشمی اندازهگیری میشود.
Ocular-dominance columns reflect the segregation of thalamocortical inputs arriving from different layers of the LGN. Alternating layers of this nucleus receive input from retinal ganglion cells located in either the ipsilateral or contralateral retina (Figure 21-12). This segregation is maintained in the inputs from the LGN to the primary visual cortex, producing the alternating left-eye and right-eye ocular dominance bands (Figure 21-11B).
ستونهای غلبه چشمی، تفکیک ورودیهای تالاموکورتیکال دریافتی از لایههای مختلف LGN را نشان میدهند. لایههای متناوب این هسته، ورودی را از سلولهای گانگلیونی شبکیه واقع در شبکیه همان طرف یا طرف مقابل دریافت میکنند (شکل 21-12). این تفکیک در ورودیهای LGN به قشر بینایی اولیه حفظ میشود و نوارهای غلبه چشمی متناوب چشم چپ و چشم راست را ایجاد میکند (شکل 21-11B).
Cells with similar orientation preferences are also grouped into columns. Across the cortical surface, there is a regular clockwise and counterclockwise cycling of orientation preference, with the full 180° cycle repeating every 750 μm (Figure 21-11C). Likewise, the left- and right-eye dominance columns alternate with a periodicity of 750 to 1,000 μm. One full cycle of orientation columns, or a full pair of left- and right-eye dominance columns, is called a hypercolumn. The orientation and ocular dominance columns at each point on the cortical surface are locally roughly orthogonal to each other. Thus, a cortical patch one hypercolumn in extent contains all possible combinations of orientation preference and left- and right-eye dominance.
سلولهایی با ترجیحات جهتگیری مشابه نیز در ستونهایی گروهبندی میشوند. در سراسر سطح قشر مغز، یک چرخه منظم ساعتگرد و پادساعتگرد از ترجیح جهتگیری وجود دارد که چرخه کامل ۱۸۰ درجه هر ۷۵۰ میکرومتر تکرار میشود (شکل ۲۱-۱۱C). به همین ترتیب، ستونهای تسلط چشم چپ و راست با تناوب ۷۵۰ تا ۱۰۰۰ میکرومتر به طور متناوب تغییر میکنند. یک چرخه کامل از ستونهای جهتگیری، یا یک جفت کامل از ستونهای تسلط چشم چپ و راست، یک ابرستون نامیده میشود. ستونهای جهتگیری و تسلط چشمی در هر نقطه از سطح قشر مغز، به صورت محلی تقریباً عمود بر یکدیگر هستند. بنابراین، یک تکه قشر مغز به وسعت یک ابرستون، شامل تمام ترکیبات ممکن از ترجیح جهتگیری و تسلط چشم چپ و راست است.

Figure 21-10 Receptive field size, eccentricity, retinotopic organization, and magnification factor. The color code refers to position in visual space or on the retina.
شکل 21-10 اندازه میدان دریافتی، خروج از مرکز، سازماندهی رتینوتوپیک و ضریب بزرگنمایی. کد رنگی به موقعیت در فضای بینایی یا روی شبکیه اشاره دارد.
A. The distance of a receptive field from the fovea is referred to as the eccentricity of the receptive field.
الف) فاصلهی یک میدان گیرنده از فووآ، خروج از مرکز میدان گیرنده نامیده میشود.
B. Receptive field size varies with distance from the fovea. The smallest fields lie in the center of gaze, the fovea, where the visual resolution is highest; fields become progressively larger with distance from the fovea.
ب. اندازه میدان دید با فاصله از گودی مرکزی چشم تغییر میکند. کوچکترین میدانها در مرکز نگاه، یعنی گودی مرکزی چشم، قرار دارند، جایی که وضوح بینایی بالاترین است؛ میدانها با فاصله از گودی مرکزی به تدریج بزرگتر میشوند.
C. The amount of cortical area dedicated to inputs from within each degree of visual space, known as the magnification factor, also varies with eccentricity. The central part of the visual field commands the largest area of cortex. For example, in area V1, more area is dedicated to the central 10° of visual space than to all the rest. The map of V1 shows the cortical sheet unfolded.
ج. میزان ناحیه قشری اختصاص داده شده به ورودیها از درون هر درجه از فضای بصری، که به عنوان ضریب بزرگنمایی شناخته میشود، نیز با خروج از مرکز تغییر میکند. بخش مرکزی میدان بینایی، بزرگترین ناحیه قشر را در اختیار دارد. به عنوان مثال، در ناحیه V1، ناحیه بیشتری به 10 درجه مرکزی فضای بصری نسبت به بقیه اختصاص داده شده است. نقشه V1، صفحه قشری را به صورت باز نشان میدهد.
Both types of columns were first mapped by recording the responses of neurons at closely spaced electrode penetrations in the cortex. The ocular-dominance columns were also identified by making lesions or tracer injections in individual layers of the LGN. More recently, a technique known as optical imaging has enabled researchers to visualize a surface representation of the orientation and ocular dominance columns in living animals. Developed for studies of cortical organization by Amiram Grinvald, this technique visualizes changes in surface reflectance associated with the metabolic requirements of active groups of neurons, known as intrinsic- signal optical imaging, or changes in fluorescence of voltage-sensitive dyes. Intrinsic-signal imaging depends on activity-associated changes in local blood flow and alterations in the oxidative state of hemoglobin and other intrinsic chromophores. These techniques are also now being complemented with imaging at cellular resolution using genetically encoded markers of neural activity.
هر دو نوع ستون ابتدا با ثبت پاسخ نورونها در نفوذ الکترودهای نزدیک به هم در قشر مغز، نقشهبرداری شدند. ستونهای غالب چشمی نیز با ایجاد ضایعات یا تزریق ردیاب در لایههای جداگانه LGN شناسایی شدند. اخیراً، تکنیکی به نام تصویربرداری نوری، محققان را قادر ساخته است تا نمایش سطحی از جهتگیری و ستونهای غالب چشمی را در حیوانات زنده تجسم کنند. این تکنیک که برای مطالعات سازماندهی قشر مغز توسط امیرام گرینوالد توسعه داده شده است، تغییرات در بازتاب سطح مرتبط با نیازهای متابولیک گروههای فعال نورونها را که به عنوان تصویربرداری نوری سیگنال ذاتی یا تغییرات در فلورسانس رنگهای حساس به ولتاژ شناخته میشود، تجسم میکند. تصویربرداری سیگنال ذاتی به تغییرات مرتبط با فعالیت در جریان خون موضعی و تغییرات در حالت اکسیداتیو هموگلوبین و سایر کروموفورهای ذاتی بستگی دارد. این تکنیکها اکنون با تصویربرداری با وضوح سلولی با استفاده از نشانگرهای کدگذاری شده ژنتیکی فعالیت عصبی نیز تکمیل میشوند.
An experimenter can visualize the distribution of cells with left or right ocular dominance, for example, by subtracting the image obtained while stimulating one eye from that acquired while stimulating the other. When viewed in a plane tangential to the cortical surface, the ocular dominance columns appear as alternating left and right-eye stripes, each approximately 750 um in width (Figure 21-11B).
یک آزمایشگر میتواند توزیع سلولهای دارای غلبه چشمی چپ یا راست را تجسم کند، برای مثال، با کم کردن تصویر به دست آمده هنگام تحریک یک چشم از تصویری که هنگام تحریک چشم دیگر به دست آمده است. هنگامی که در صفحهای مماس بر سطح قشر مغز مشاهده شود، ستونهای غلبه چشمی به صورت نوارهای متناوب چشم چپ و راست ظاهر میشوند که هر کدام تقریباً 750 میکرومتر عرض دارند (شکل 21-11B).
The cycles of orientation columns form various structures, from parallel stripes to pinwheels. Sharp jumps in orientation preference occur at the pinwheel centers and “fractures” in the orientation map (Figure 21-11C).
چرخههای ستونهای جهتگیری، ساختارهای مختلفی را تشکیل میدهند، از نوارهای موازی گرفته تا فرفرهها. جهشهای شدید در ترجیح جهتگیری در مراکز فرفرهها و “شکستگیها” در نقشه جهتگیری رخ میدهد (شکل 21-11C).
Embedded within the orientation and ocular- dominance columns are clusters of neurons that have poor orientation selectivity but strong color preferences. These units of specialization, located within the superficial layers, were revealed by a histochemical label for the enzyme cytochrome oxidase, which is distributed in a regular patchy pattern of blobs and interblobs. In the primary visual cortex, these blobs are a few hundred micrometers in diameter and 750 μm apart (Figure 21-11D). The blobs correspond to clusters of color-selective neurons. Because they are rich in cells with color selectivity and poor in cells with orientation selectivity, the blobs are specialized to provide information about surfaces rather than edges.
درون ستونهای جهتگیری و غلبه چشمی، خوشههایی از نورونها قرار دارند که گزینشپذیری جهتگیری ضعیفی دارند اما ترجیحات رنگی قویای دارند. این واحدهای تخصصی که در لایههای سطحی قرار دارند، توسط یک برچسب هیستوشیمیایی برای آنزیم سیتوکروم اکسیداز آشکار شدند که در یک الگوی منظم تکهتکه از حبابها و بین حبابها توزیع شده است. در قشر بینایی اولیه، این حبابها چند صد میکرومتر قطر و 750 میکرومتر از هم فاصله دارند (شکل 21-11D). این حبابها مربوط به خوشههایی از نورونهای انتخابگر رنگ هستند. از آنجا که آنها غنی از سلولهایی با گزینشپذیری رنگ و ضعیف از سلولهایی با گزینشپذیری جهتگیری هستند، این حبابها برای ارائه اطلاعات در مورد سطوح به جای لبهها تخصص یافتهاند.
In area V2, thick and thin dark stripes separated by pale stripes are evident with cytochrome oxidase labeling (Figure 21-11D). The thick stripes contain neurons selective for direction of movement and for binocular disparity as well as cells that are responsive to illusory contours and global disparity cues. The thin stripes hold cells specialized for color. The pale stripes contain orientation-selective neurons.
در ناحیه V2، نوارهای تیره ضخیم و نازک که توسط نوارهای کمرنگ از هم جدا شدهاند، با برچسبگذاری سیتوکروم اکسیداز مشهود هستند (شکل 21-11D). نوارهای ضخیم حاوی نورونهایی هستند که برای جهت حرکت و برای ناهمگونی دوچشمی انتخابی هستند و همچنین سلولهایی که به خطوط موهوم و نشانههای ناهمگونی کلی پاسخ میدهند. نوارهای نازک سلولهایی را در خود جای دادهاند که برای رنگ تخصص یافتهاند. نوارهای کمرنگ حاوی نورونهای انتخابگر جهت هستند.
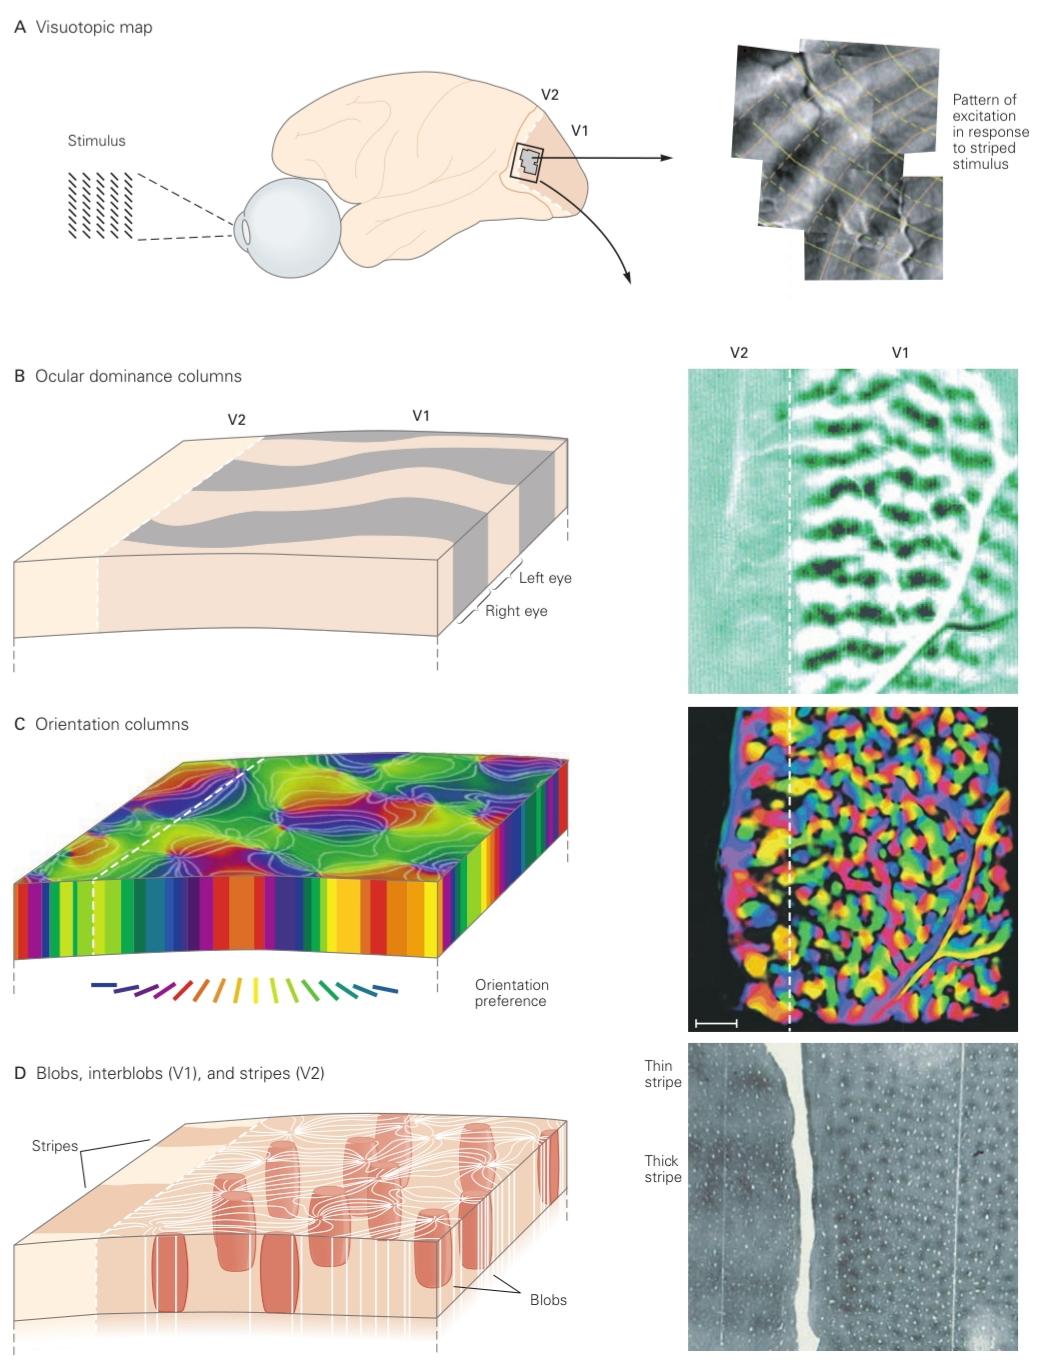
Figure 21-11 (Opposite) Functional architecture of the primary visual cortex. (Courtesy of M. Kinoshita and A. Das, reproduced with permission.)
شکل ۲۱-۱۱ (روبرو) معماری عملکردی قشر بینایی اولیه. (با اجازه M. Kinoshita و A. Das، با اجازه بازتولید شده است.)
A. The surface of the primary visual cortex is functionally organized as a map of the visual field. The elevations and azimuths of visual space are organized in a regular grid that is distorted because of variation in the magnification factor (see Figure 21-10). The grid is visible here in the dark stripes (visualized with intrinsic- signal optical imaging), which reflect the pattern of neurons that responded to a series of vertical candy stripes. Within this surface map, one finds repeated superimposed cycles of functionally specific columns of cells, as illustrated in B, C, and D.
الف) سطح قشر بینایی اولیه از نظر عملکردی به عنوان نقشهای از میدان بینایی سازماندهی شده است. ارتفاعات و آزیموتهای فضای بینایی در یک شبکه منظم سازماندهی شدهاند که به دلیل تغییر در ضریب بزرگنمایی، دچار اعوجاج شده است (شکل 21-10 را ببینید). این شبکه در اینجا به صورت نوارهای تیره (که با تصویربرداری نوری سیگنال ذاتی تجسم شدهاند) قابل مشاهده است، که الگوی نورونهایی را که به یک سری نوارهای آبنباتی عمودی پاسخ دادهاند، منعکس میکند. در این نقشه سطحی، چرخههای مکرر روی هم قرار گرفته ستونهای سلولی با عملکرد خاص، همانطور که در B، C و D نشان داده شده است، یافت میشود.
B. The dark and light stripes represent the surface view of the left and right ocular dominance columns. These stripes intersect the border between areas V1 and V2, the representation of the vertical meridian, at right angles.
ب. نوارهای تیره و روشن، نمای سطحی ستونهای تسلط چشمی چپ و راست را نشان میدهند. این نوارها مرز بین نواحی V1 و V2، که نمایانگر نصفالنهار عمودی هستند، را با زاویه قائمه قطع میکنند.
C. Some columns contain cells with similar selectivity for the orientation of stimuli. The different colors indicate the orientation preference of the columns. The orientation columns in surface view are best described as pinwheels surrounding singularities of sudden changes in orientation (the center of the pinwheel). The scale bar represents 1 mm. (Surface image of orientation columns on the left courtesy of G. Blasdel, reproduced with permission.)
ج. برخی از ستونها حاوی سلولهایی با گزینشپذیری مشابه برای جهتگیری محرکها هستند. رنگهای مختلف نشاندهندهی ترجیح جهتگیری ستونها هستند. ستونهای جهتگیری در نمای سطحی، به بهترین شکل به صورت چرخدندههایی توصیف میشوند که نقاط تکین با تغییرات ناگهانی در جهتگیری (مرکز چرخدنده) را احاطه کردهاند. نوار مقیاس نشاندهندهی ۱ میلیمتر است. (تصویر سطحی ستونهای جهتگیری در سمت چپ، با اجازهی جی. بلاسدل، بازتولید شده است.)
D. Patterns of blobs in V1 and stripes in V2 represent other modules of functional organization. These patterns are visualized with cytochrome oxidase.
د. الگوهای لکهها در V1 و نوارها در V2 نشاندهندهی سایر ماژولهای سازماندهی عملکردی هستند. این الگوها با سیتوکروم اکسیداز قابل مشاهده هستند.

Figure 21-12 Projections from the lateral geniculate nucleus to the visual cortex. The lateral geniculate nucleus in each hemisphere receives input from the temporal retina of the ipsilateral eye and the nasal retina of the contralateral eye. The nucleus is a layered structure comprising four parvocellular layers (layers 3 to 6) and two magnocellular layers (layers 1 and 2). Each is paired with an intercalated koniocellular layer. (These layers are represented here by the gaps separating the primary layers. They are unlabeled to avoid clutter. See Figure 21-14.) The inputs from the two eyes terminate in different geniculate layers: The contralateral eye projects to layers 1, 4, and 6, whereas the ipsilateral eye sends input to layers 2, 3, and 5. Neurons from these geniculate layers then project to different layers of cortex. The parvocellular geniculate neurons project to layer IVCβ, the magnocellular ones project to layer IVCα, and the koniocellular ones project to “blobs” in the upper cortical layers (see Figures 21-14 and 21-15). In addition, the afferents from the ipsilateral and contralateral layers of the lateral geniculate nucleus are segregated into alternating ocular-dominance columns.
شکل ۲۱-۱۲ برونریزیهای هسته زانویی جانبی به قشر بینایی. هسته زانویی جانبی در هر نیمکره، ورودی را از شبکیه گیجگاهی چشم همان طرف و شبکیه بینی چشم طرف مقابل دریافت میکند. این هسته یک ساختار لایهای است که شامل چهار لایه پاروسلولی (لایههای ۳ تا ۶) و دو لایه مگنوسلولاری (لایههای ۱ و ۲) است. هر کدام با یک لایه کونیوسلولاری بینابینی جفت شدهاند. (این لایهها در اینجا با شکافهایی که لایههای اولیه را از هم جدا میکنند، نشان داده شدهاند. برای جلوگیری از درهمریختگی، بدون برچسب هستند. به شکل ۲۱-۱۴ مراجعه کنید.) ورودیهای دو چشم در لایههای زانویی مختلف خاتمه مییابند: چشم طرف مقابل به لایههای ۱، ۴ و ۶ برونریزی میکند، در حالی که چشم همان طرف ورودی را به لایههای ۲، ۳ و ۵ ارسال میکند. سپس نورونهای این لایههای زانویی به لایههای مختلف قشر مغز برونریزی میکنند. نورونهای زانویی پارووسلولار به لایه IVCβ، نورونهای مگنوسلولار به لایه IVCα و نورونهای کونیوسلولار به صورت “حباب” در لایههای قشری فوقانی امتداد مییابند (شکلهای 21-14 و 21-15 را ببینید). علاوه بر این، آورانهای لایههای همان طرف و طرف مقابل هسته زانویی جانبی به صورت ستونهای متناوب با غلبه چشمی تفکیک میشوند.
For every visual attribute to be analyzed at each position in the visual field, there must be adequate tiling, or coverage, of neurons with different functional properties. As one moves in any direction across the cortical surface, the progression of the visuotopic location of receptive fields is gradual, whereas the cycling of columns occurs more rapidly. Any given position in the visual field can therefore be analyzed adequately in terms of the orientation of contours, the color and direction of movement of objects, and stereoscopic depth by a single computational module. The small segment of visual cortex that comprises such a module represents all possible values of all the columnar systems (Figure 21-13).
برای اینکه هر ویژگی بصری در هر موقعیت در میدان بینایی مورد تجزیه و تحلیل قرار گیرد، باید کاشیکاری یا پوشش کافی از نورونها با ویژگیهای عملکردی مختلف وجود داشته باشد. با حرکت در هر جهتی در سطح قشر مغز، پیشرفت موقعیت بصری-مکانیابی میدانهای گیرنده تدریجی است، در حالی که چرخه ستونها سریعتر اتفاق میافتد. بنابراین، هر موقعیت مشخص در میدان بینایی میتواند به طور کافی از نظر جهتگیری خطوط، رنگ و جهت حرکت اشیاء و عمق استریوسکوپی توسط یک ماژول محاسباتی واحد تجزیه و تحلیل شود. بخش کوچکی از قشر بینایی که شامل چنین ماژولی است، تمام مقادیر ممکن از تمام سیستمهای ستونی را نشان میدهد (شکل 21-13).
The columnar systems serve as the substrate for two fundamental types of connectivity along the visual pathway. Serial processing occurs in the successive connections between cortical areas, connections that run from the back of the brain forward. At the same time, parallel processing occurs simultaneously in subsets of fibers that process different submodalities such as form, color, and movement, continuing the neural processing strategy started in the retina.
سیستمهای ستونی به عنوان بستر دو نوع اتصال اساسی در طول مسیر بینایی عمل میکنند. پردازش سریالی در اتصالات متوالی بین نواحی قشری رخ میدهد، اتصالاتی که از پشت مغز به جلو امتداد دارند. در عین حال، پردازش موازی به طور همزمان در زیرمجموعههایی از فیبرها رخ میدهد که زیرمقیاسهای مختلفی مانند شکل، رنگ و حرکت را پردازش میکنند و استراتژی پردازش عصبی را که در شبکیه آغاز شده است، ادامه میدهند.
Many areas of visual cortex reflect this arrangement; for example, functionally specific cells in V1 communicate with cells of the same specificity in V2. These pathways are not absolutely segregated, how- ever, for there is some mixing of information between different visual attributes (Figure 21-14).
بسیاری از نواحی قشر بینایی این ترتیب را منعکس میکنند؛ برای مثال، سلولهای با عملکرد خاص در V1 با سلولهایی با همان ویژگی در V2 ارتباط برقرار میکنند. با این حال، این مسیرها کاملاً از هم جدا نیستند، زیرا مقداری اختلاط اطلاعات بین ویژگیهای بصری مختلف وجود دارد (شکل 21-14).
Columnar organization confers several advantages. It minimizes the distance required for neurons with similar functional properties to communicate with one another and allows them to share inputs from discrete pathways that convey information about particular sensory attributes. This efficient connectivity economizes on the use of brain volume and maximizes processing speed. The clustering of neurons into functional groups, as in the columns of the cortex, allows the brain to minimize the number of neurons required for analyzing different attributes. If all neurons were tuned for every attribute, the resultant combinatorial explosion would require a prohibitive number of neurons.
سازماندهی ستونی مزایای متعددی دارد. این ساختار، فاصله مورد نیاز برای ارتباط نورونها با ویژگیهای عملکردی مشابه با یکدیگر را به حداقل میرساند و به آنها اجازه میدهد تا ورودیها را از مسیرهای گسستهای که اطلاعات مربوط به ویژگیهای حسی خاص را منتقل میکنند، به اشتراک بگذارند. این اتصال کارآمد، در استفاده از حجم مغز صرفهجویی کرده و سرعت پردازش را به حداکثر میرساند. خوشهبندی نورونها در گروههای عملکردی، مانند ستونهای قشر مغز، به مغز اجازه میدهد تا تعداد نورونهای مورد نیاز برای تجزیه و تحلیل ویژگیهای مختلف را به حداقل برساند. اگر همه نورونها برای هر ویژگی تنظیم شوند، انفجار ترکیبی حاصل به تعداد بسیار زیادی نورون نیاز خواهد داشت.
»» »» قسمت اول فصل ماهیت ساختاری پردازش بینایی
»» تمامی کتاب